April 2026 Market Update
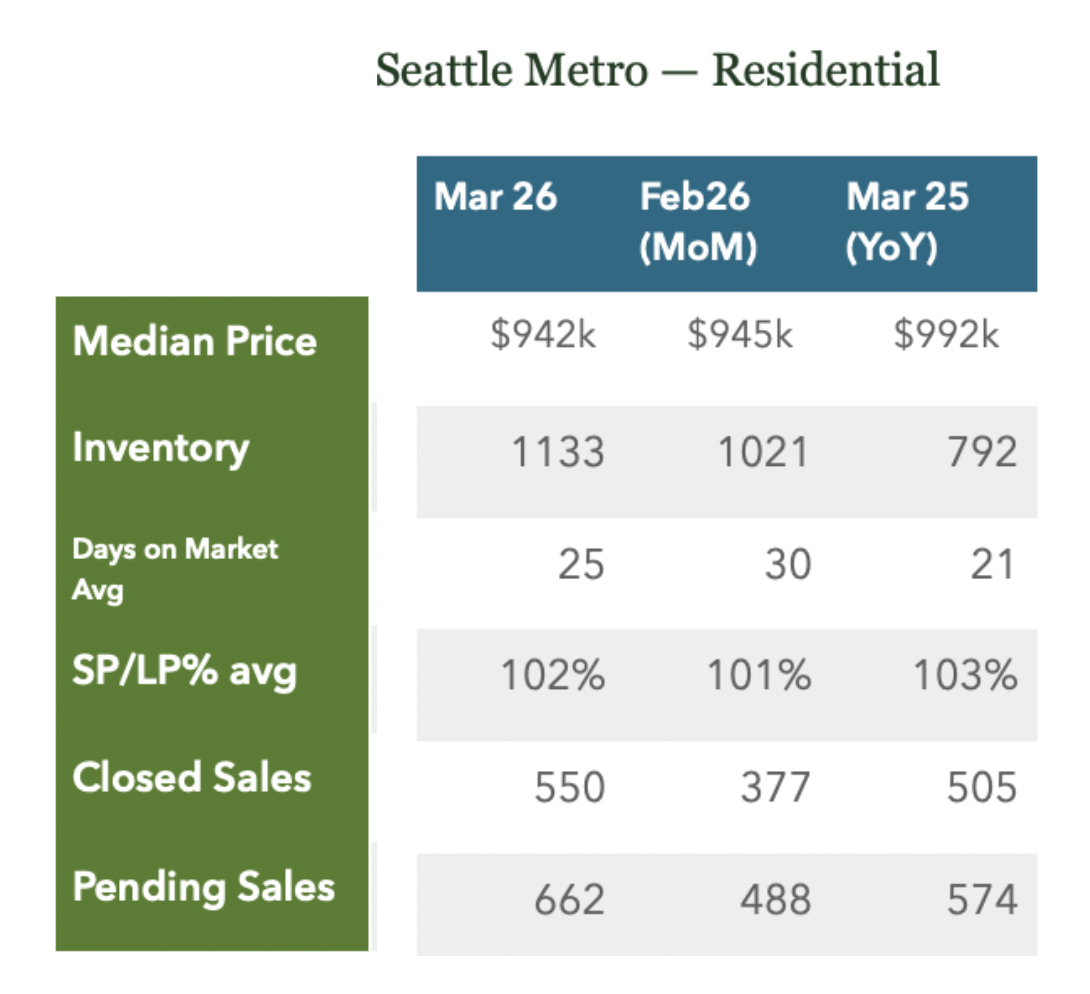
March numbers are in and show some interesting signs. We typically see, and did, increases in Inventory, Closed Sales and Pending sales. However, Median price was relatively flat Month-over-Month and Year-over-Year. Median is often more a reflection of the previous months pending sales finally closing (typical closes can take 21-30 days). But, this is historically a month when pricing starts to take off a bit. We probably are seeing impacts of the Iran War (rising interest rates and economic uncertainty) holding back the normally robust spring market. Interest rates were up to nearly 6.5% after being at and below 6% earlier in the year.
The Spring real estate market typically hits into full gear right around/after Seattle Schools (public and private) Spring Break. So, we will really be watching the next couple of weeks to see the ramifications of the current geo-political situation. Pending numbers are pretty strong but do show some softening trends.

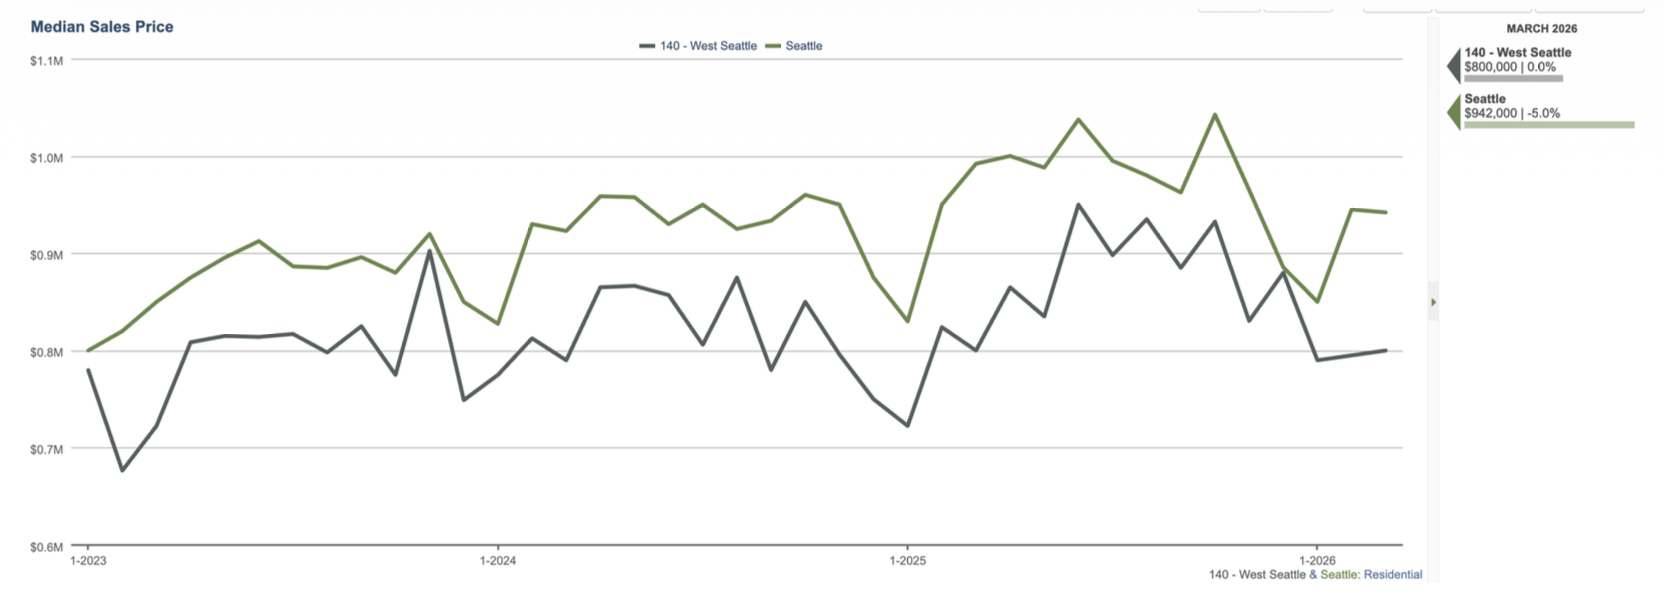
Prices are generally lowest in December and January and start to build throughout the spring and then Peak in May or June. The rising prices can be attributed to more demand, less inventory early in the year and homes strategically listing (condition and timing). We see some of the best inventory this time of year. West Seattle prices were fairly flat in March (and match 800k in March of 2025 and 790k in March of 2024). While not uncommon for peak and valley price trend, we will be watching closely to see what April’s numbers show.
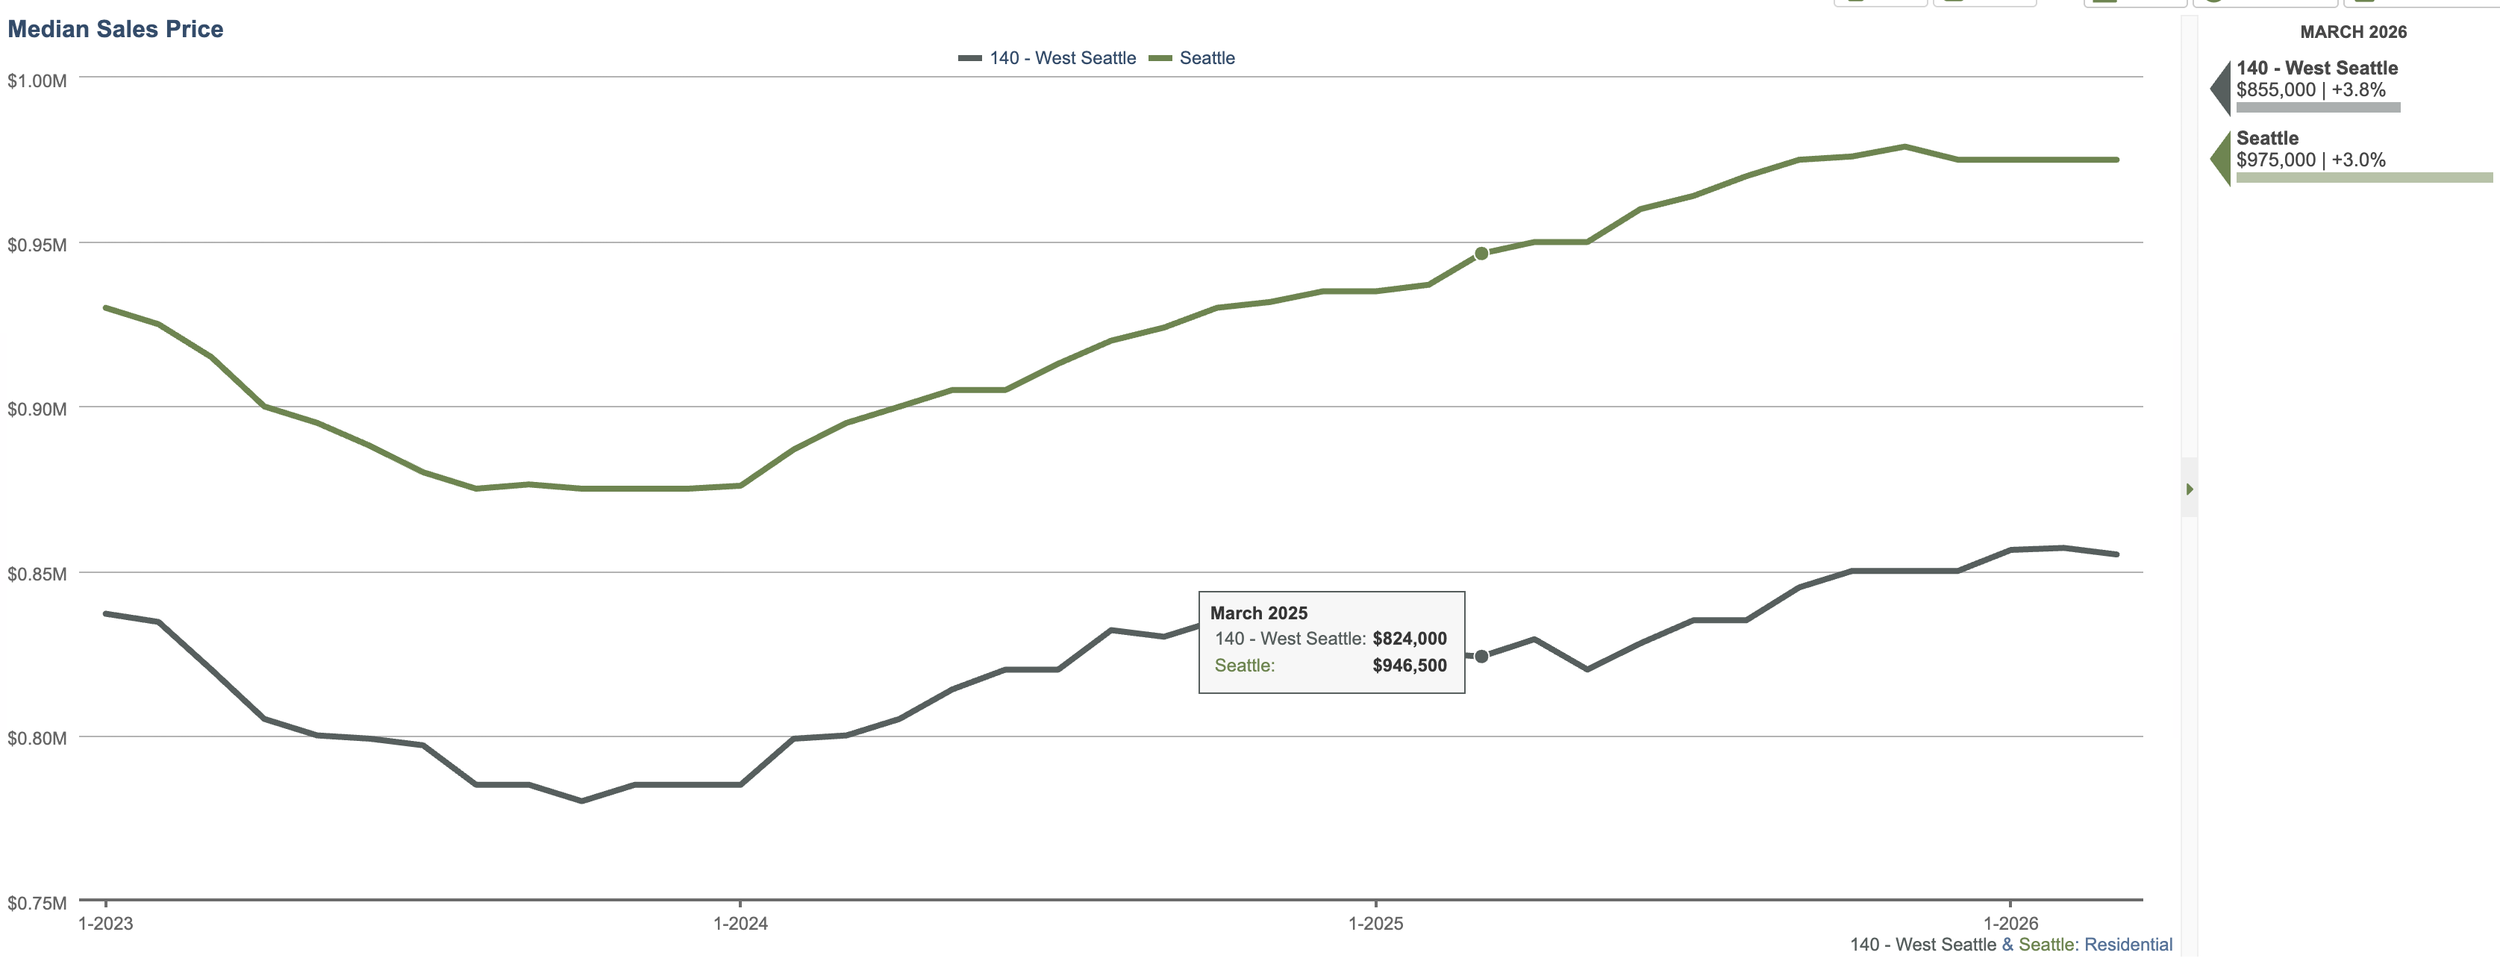
The above graph shows month-to-month trends. Here is a look at year-to-year sales data. It softens out the monthly bumps and sways. It does feel like pricing the past couple of months have crested.
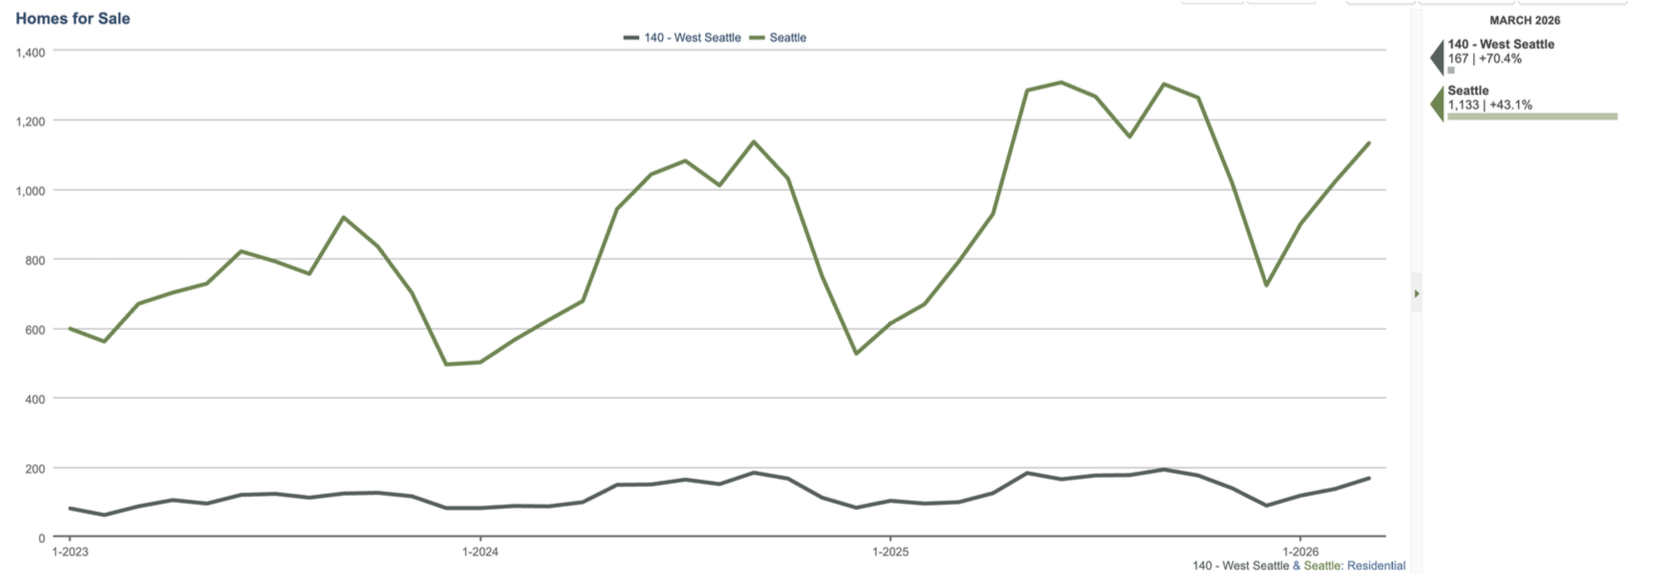
It is not unusual to see inventory build this time of year. West Seattle saw 173 ‘New Listings’ come out in March. Inventory typically starts to come out in Mid-February and really get going right after spring break through the end of the school year. Sellers often take advantage of this time of year when there are more buyers in the hunt and homes show better (more light, yards in bloom). Inventory tends to peak during summer months as it catches up with demand. Of note, about 1/4 of inventory is considered New Construction (Newly built Home/ADU/DADU/Townhome).
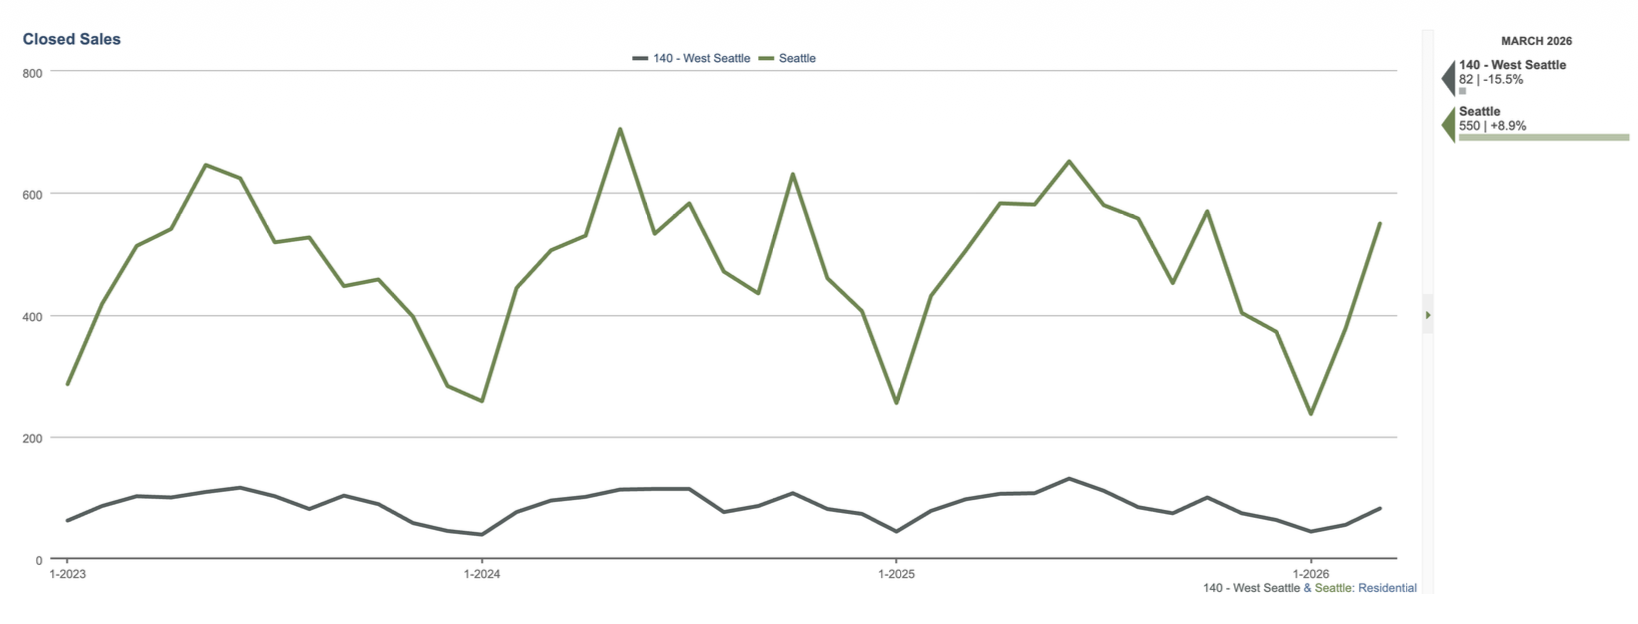
Closed sales were up from beginning of the year but a little slightly below previous March data (97 in 3/25 and 95 in 3/24). You can follow the typical yearly trends below.
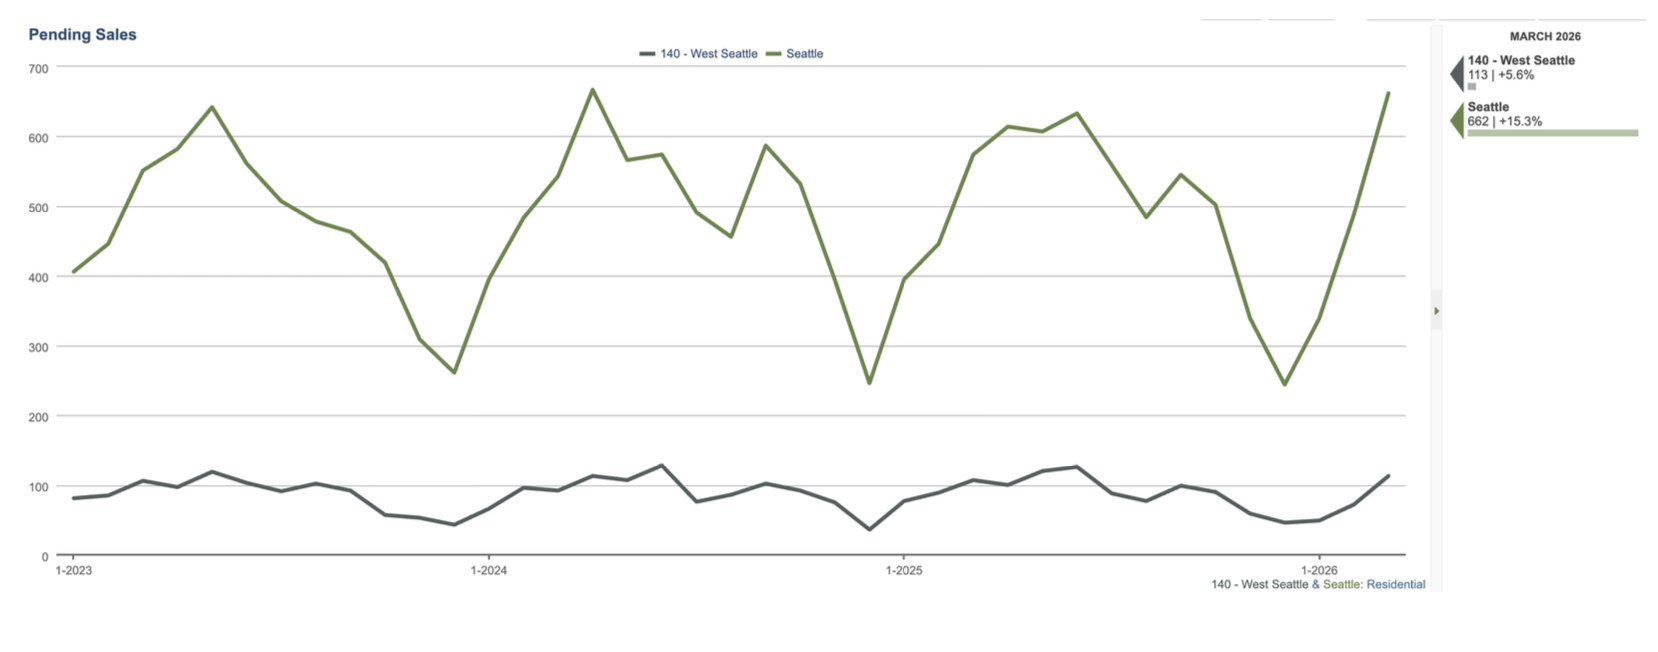
Pending numbers were encouraging. This is the time of year where we see these numbers build. April thru June is generally when we see the most amount of homes go under contract.
What might be a little different this year, from previous years, is Sales Price/List Price ratios (for pending properties) seem slightly down and there are signs of less frantic offer situations. The below data is from Seattle Metro but does show there are less Multiple Offers, Escalation Addendums and slightly more offers with Financing and Inspection Addendums.
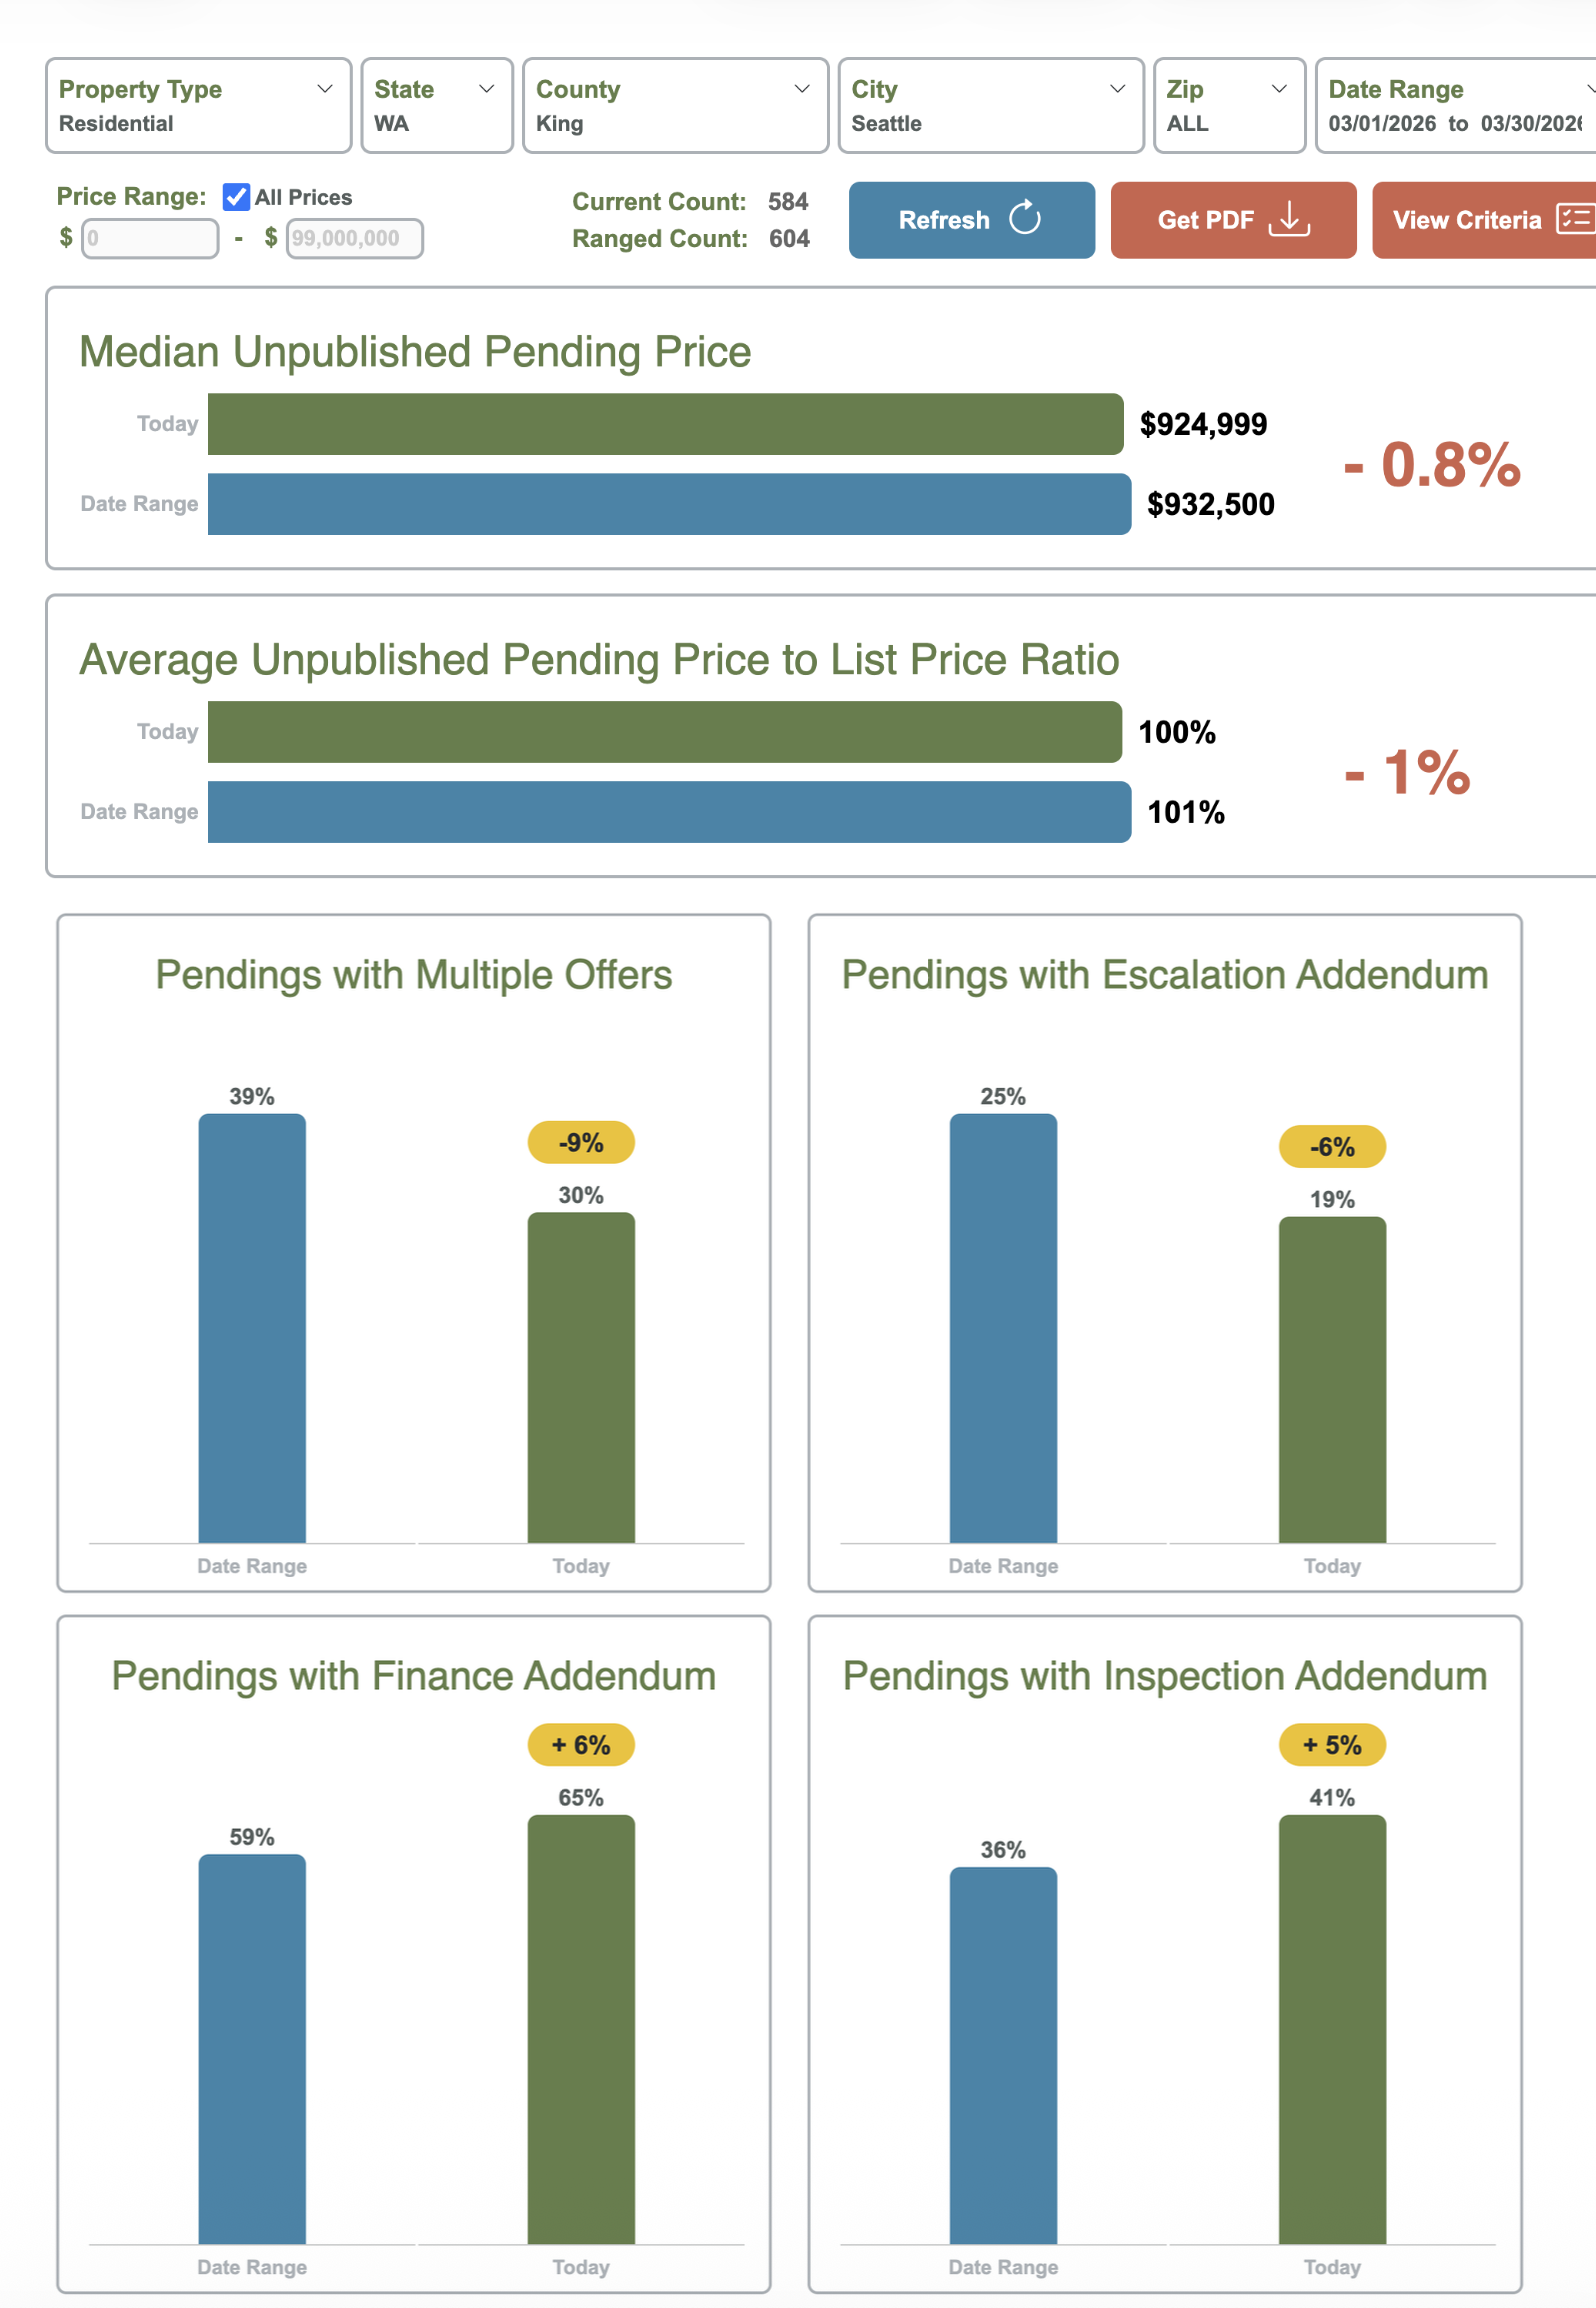
There are, of course, homes receiving multiple offers. About half of the closed sales (40+) last month received higher than 100% of list price. But we’ll get a better idea of the health of the market when we look at end of month April numbers (when these Pending numbers actually close).
Seattle Metro numbers mirrored West Seattle with flat Median Pricing, increase in Inventory, Pending and Closed Sales.