

August Market Update
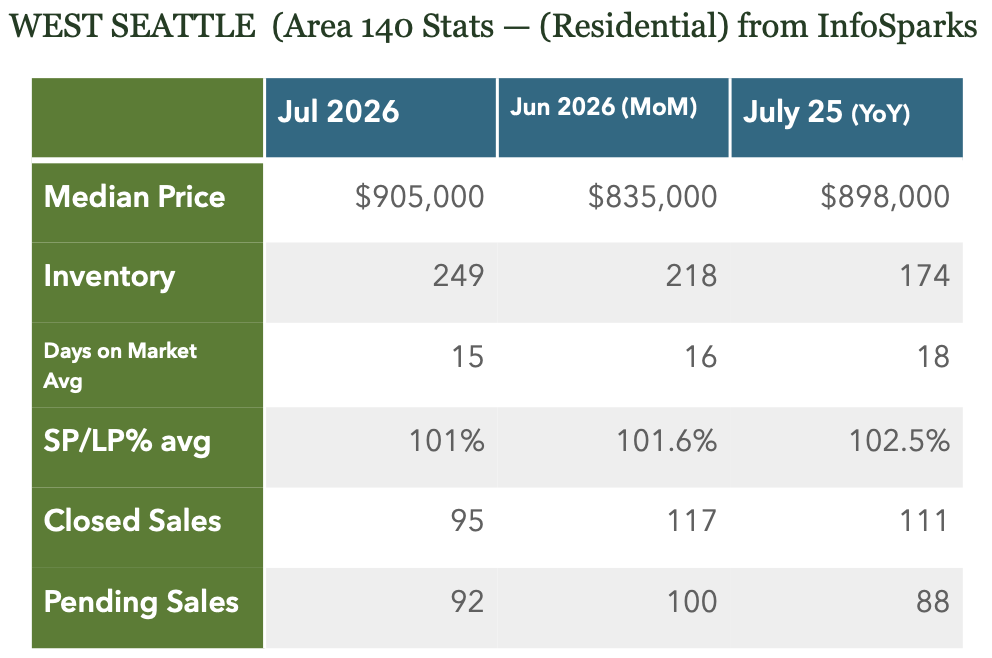
Summer is in full swing and July real estate numbers are in. Median price saw a big jump last month albeit on lower closed home numbers. Inventory continues to climb (about 25% that number is New Construction projects). The last time we averaged that many homes on market was Summer of 2020. Average Days on market was at 15. The Summer market, July and August, are historically slower months then the Spring Market, when there tends to be more demand and less inventory. We generally see peoples urgency and attention tend to wane as the weather gets better. September historically can expect an uptick in good (NEW) inventory and more sales.
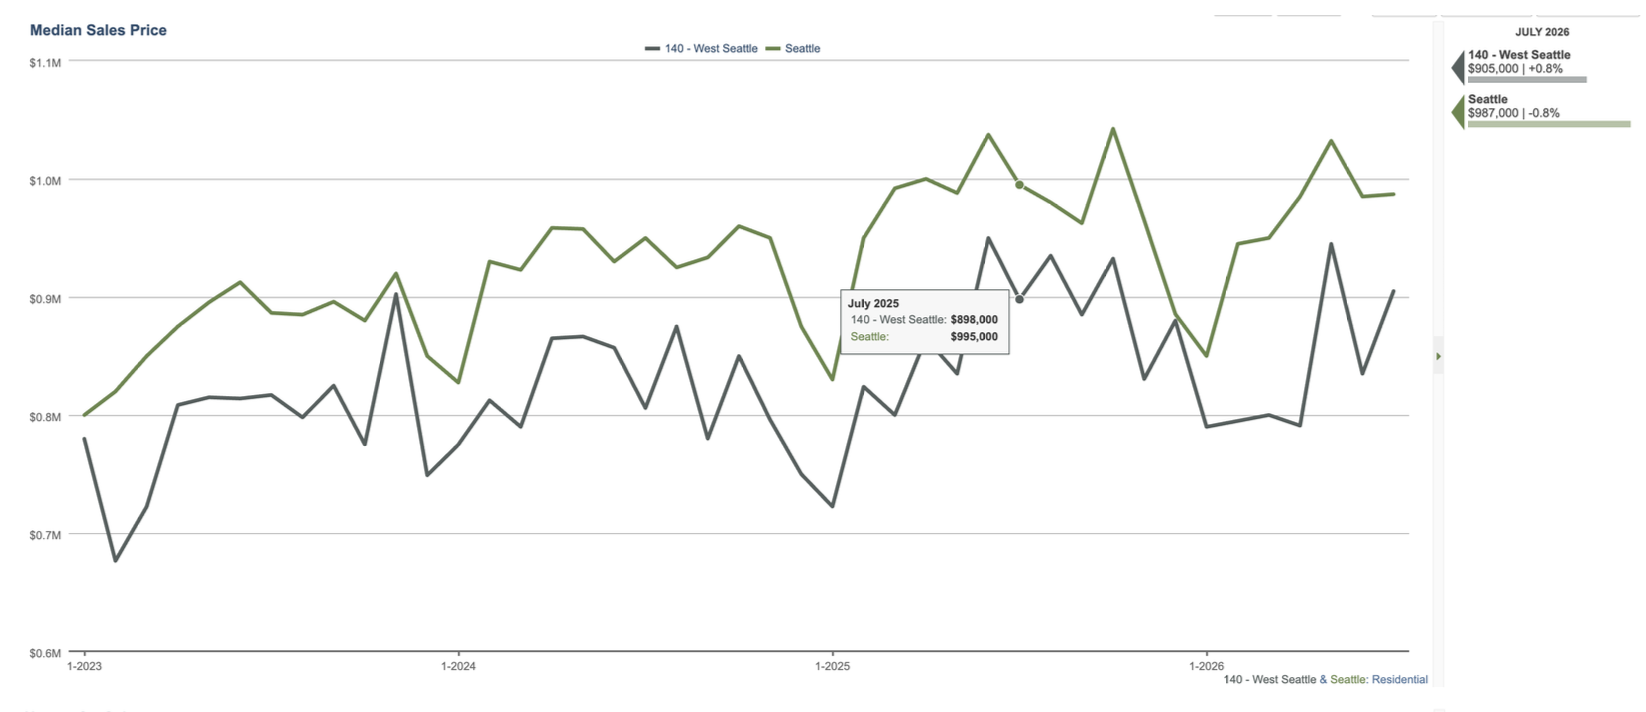
Median price followed its peak and valley nature that it follow the past several years. Homes still are selling but it seems like certain markets are performing better than others. Stand alone homes sales continue to be pretty strong but attached homes and townhomes continue to struggle.
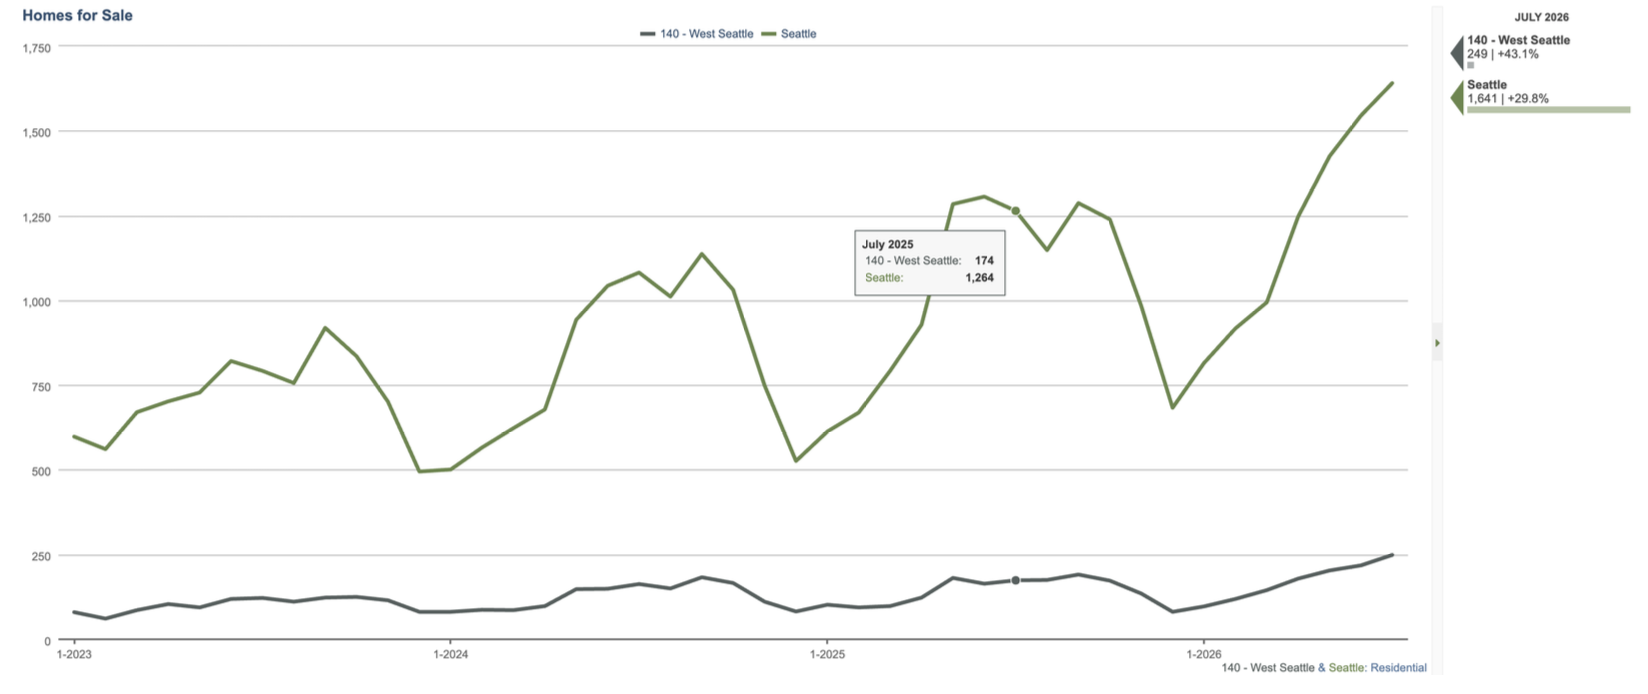
Inventory numbers continued to climb. Part of this follows seasonal trends (inventory tends to peak in Summer) but the higher number also reflects a big increase in the New Construction homes. There seems to be a glut of Townhomes, ADU and DADU inventory at the moment. 88 of the available homes are classified as Townhomes.
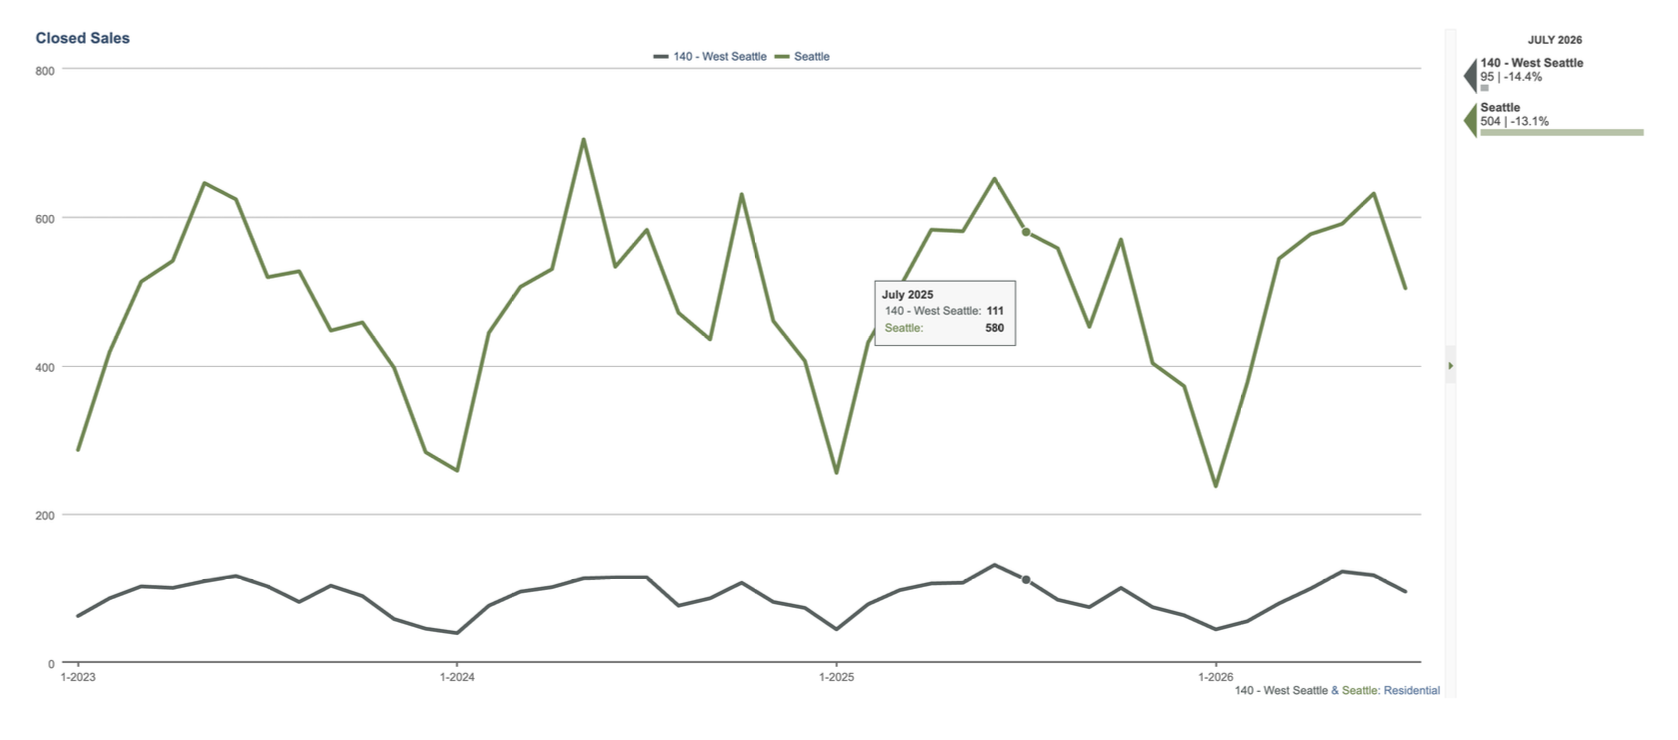
Closed sales (95) were down from the previous month (117) and from a year ago (111). Homes are either selling quickly or sitting. 69 of the 95 sold homes had days on market at 14 and less (Average DOM was at 15). So, new inventory (good condition and price) made up a bulk of those sales. 40 of the 95 sold homes for over list. Conversely, Active homes have been on the market an average of 53 days. Homes sitting on market can typically represent a condition, pricing or location challenge. Homes sitting on market may also not fit into what buyers are into at this moment. 3 bed/2+bath homes, priced between 1-1.25M continues to be a very popular product (especially along the California corridor). The townhome and condo (Not reflected in these stats) market is fairly sluggish.
Another segment struggling is New Construction. New Construction homes only made up 10 of the Closed numbers.
Here are 2 homes that received 15% and 11% over list. https://portal.onehome.com/en-US/share/1750149q37603
Pending numbers followed seasonal trends and dropped as we got into Summer. July and August tends to be slow for new sales but can pick up again in September and October. Rates have started to rise again (at 6.674% on 8/5/26) so will be watching if that has an effect as we get deeper into the year.
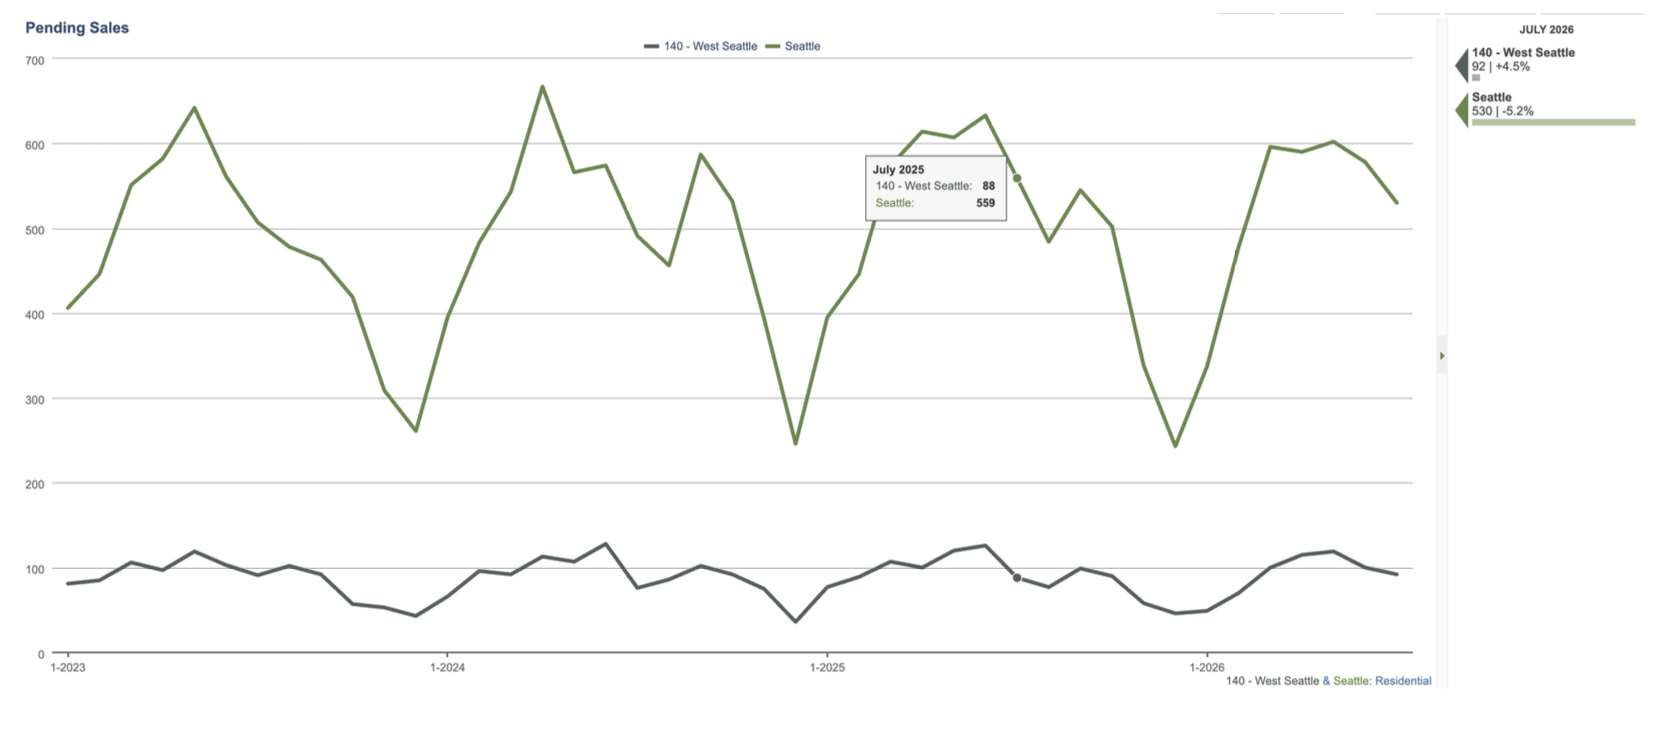
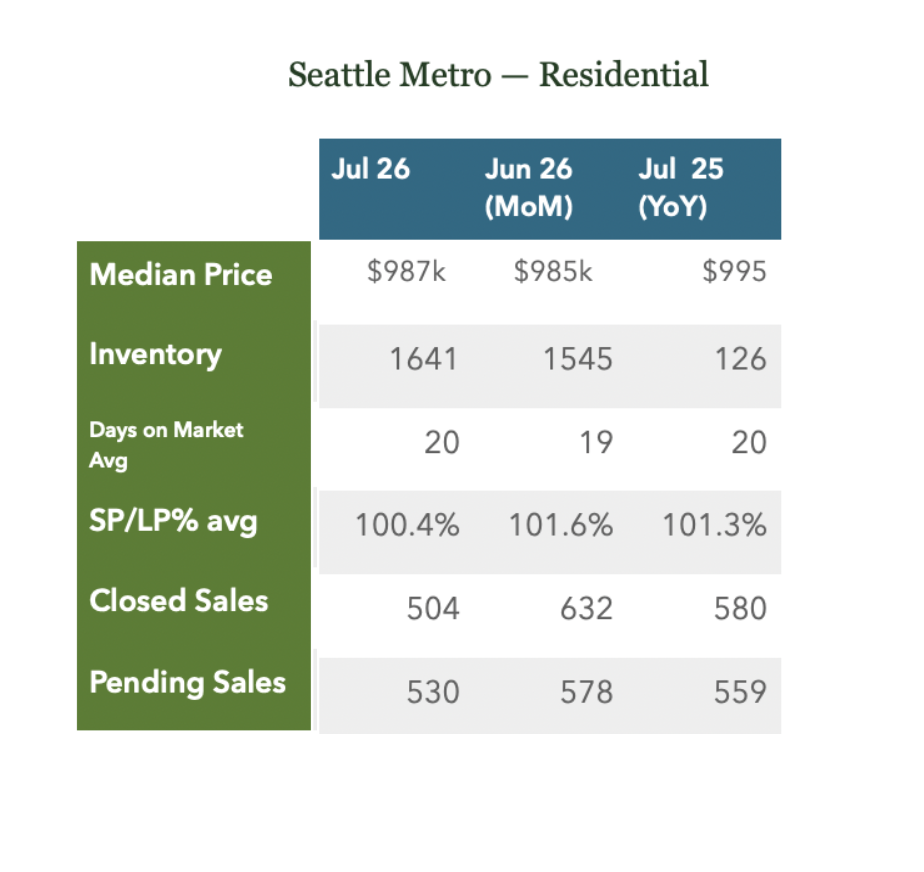
Seattle was mostly flat on Median Pricing but saw increases in Inventory and decreases in Pending and Closed Sales. This seems to be partly seasonal but also follows the yearly trend of a slowing market. Certain segments and price points do seem to be performing better than others but overall numbers for the market are down from previous years. The higher end price points, especially 1-1.25M segment, remains the market strongest. The 1.25-1.5M and 1.5-1.75M segments are doing pretty good as well city wise.
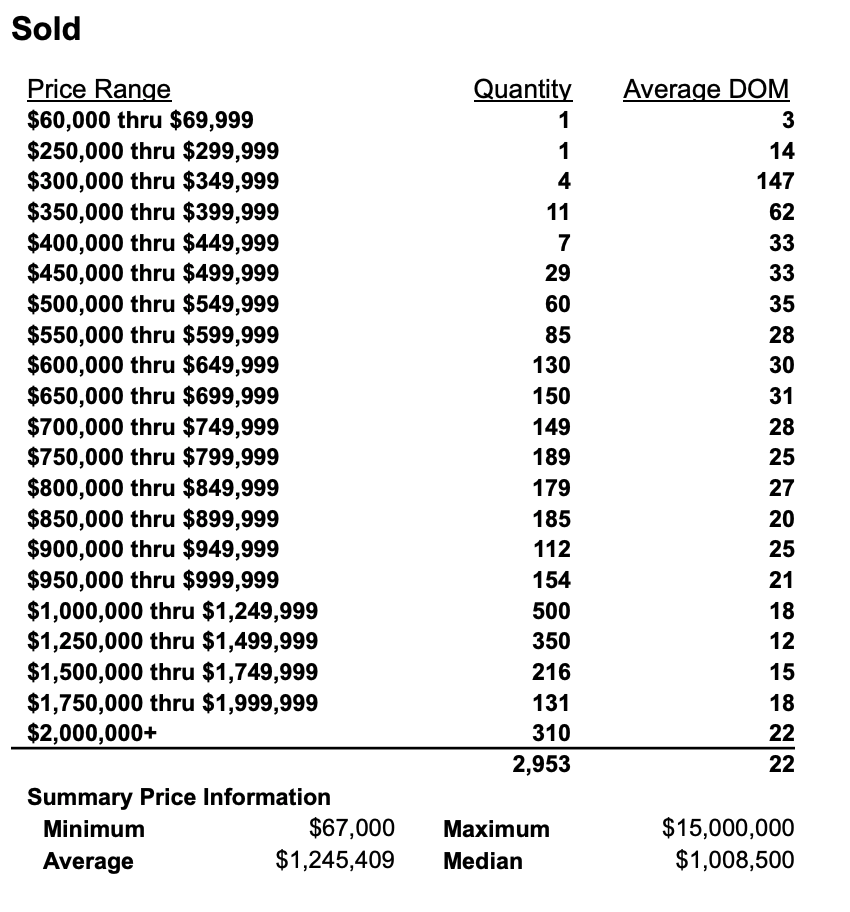
Here is break down (all of Seattle) for different price points, past 6 months.
Just for interest, here is the 15M sale. https://portal.onehome.com/en-US/share/1750211H82222. It was off market sale but looks incredible for a Lake Washington home.