

September 2026 Market Update
It still feels a little like summer with these sunny skies but the Fall Market is right around the corner. School has started, Labor day is behind us, and football season is starting up. September and Early October can be a second selling season, we generally see more new inventory and increased sales. But the end of Summer’s housing data was a little lagging so might be an indicator of a slower market. August numbers are typically never a bellwether for how the market is doing, but last months stats did show some interesting trends. Lower Median price and closed sales are fairly typical for late summer but will be watching these as we head into fall. Inflation, tariffs, higher interest rates (over 7%) and my personal pet peeve of credit card convenience fees on almost every transaction now seem to be taking a toll. It was interesting to see Pending numbers up but that may be more a case of homes not closing before the end of the month and closing the week after.
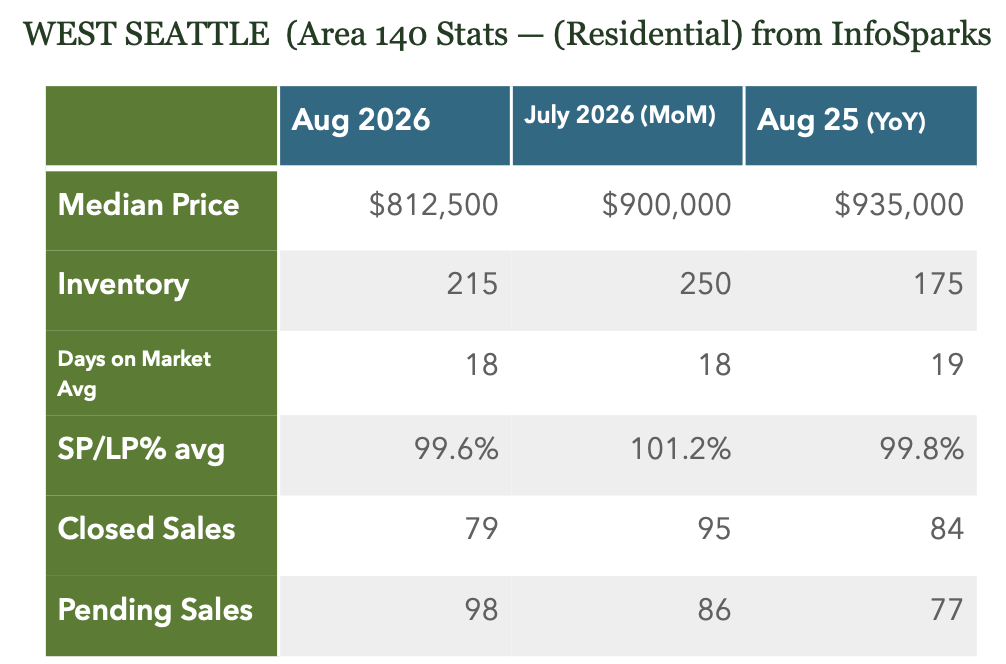
Median price took a pretty significant drop last month but you can see it’s been pretty peak and valley the past several months. Historically we get bumps in price in early Fall (October) so will be watching this number the next couple of months. The beginning of the year was fairly flat so overall this year looks to be trending flat or down.
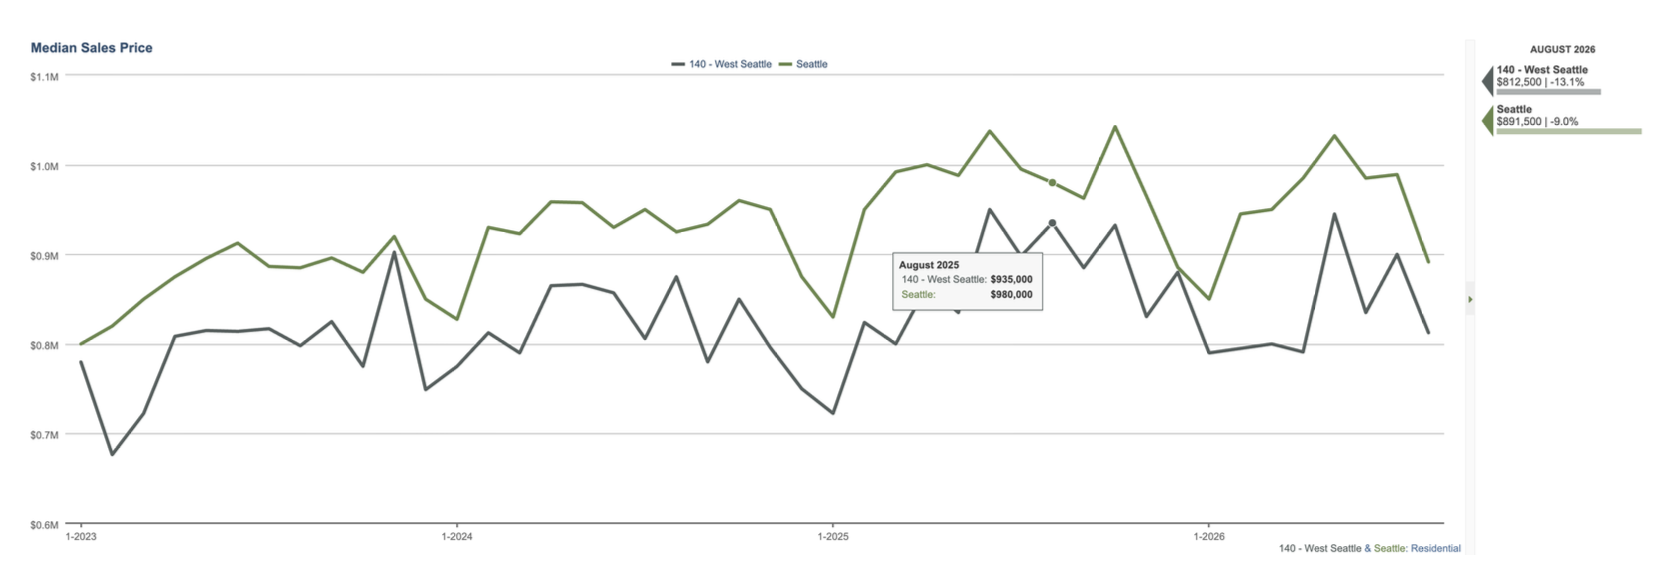
Inventory numbers actually dropped last month. It doesn’t seem that the reason is more sales. There was a big number of expired and canceled listings last month. Sometimes these get brought back on the market and other times they drop off completely. We generally see more new listings in September so would expect to see this number go up next month.
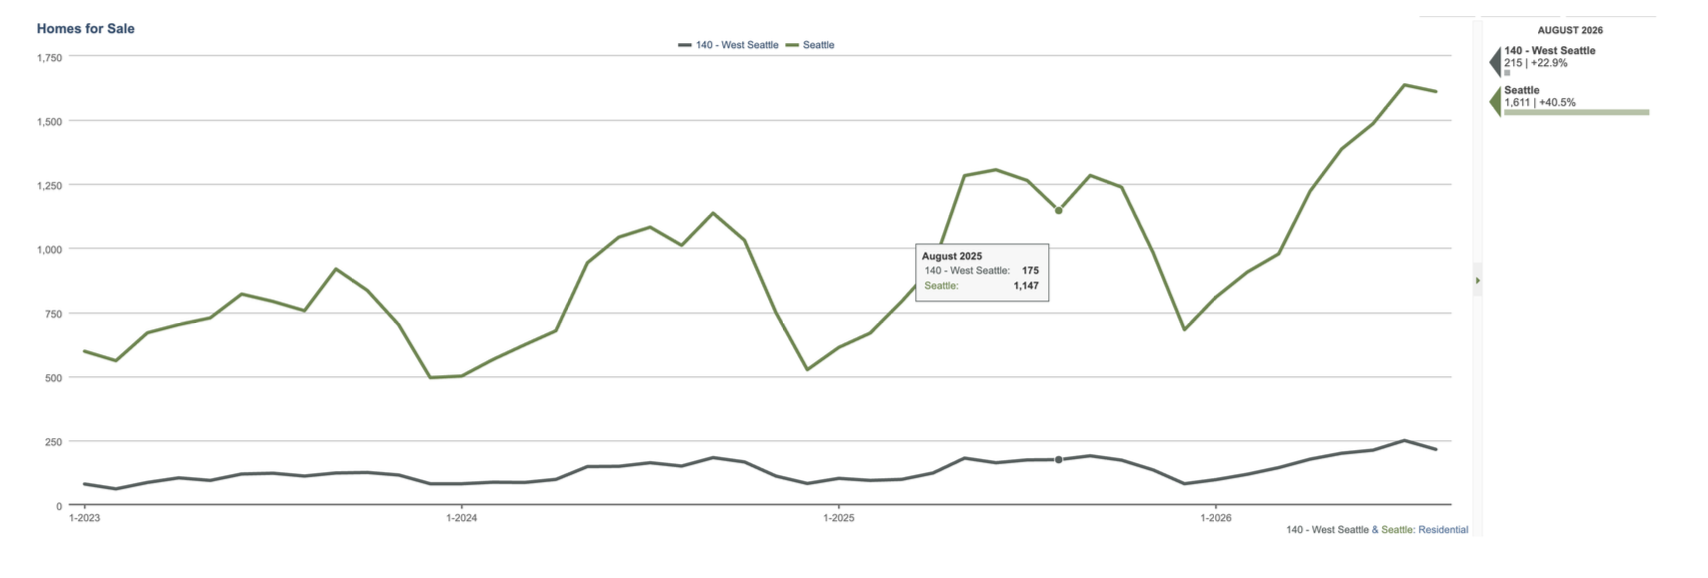
Closed sales were down MoM and YoY. There have been 749 residential Closed transactions so far in 2026 (as of 9/8/26) vs. 831 for the same period last year.
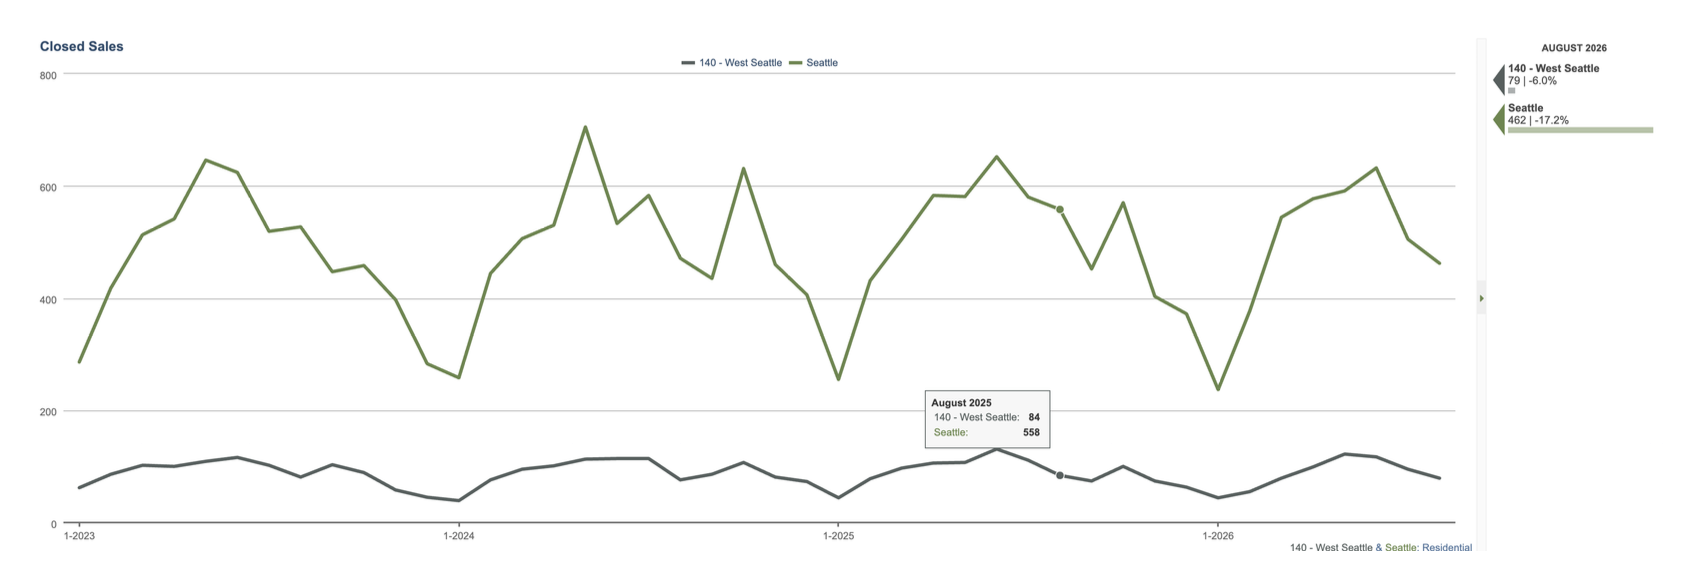
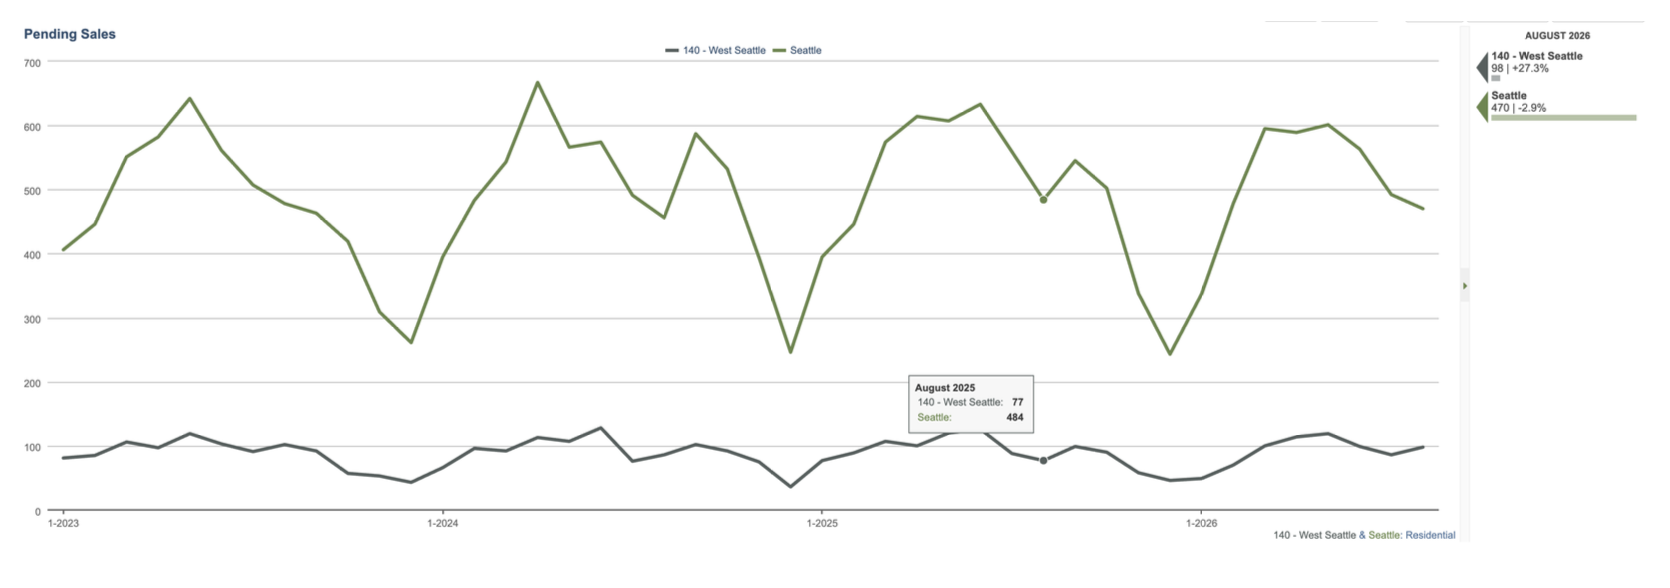
Pending numbers were slightly up but don’t think they show an upward trending market. If we add Pending and Closed for last month we are right around the previous month and a little over a year ago.
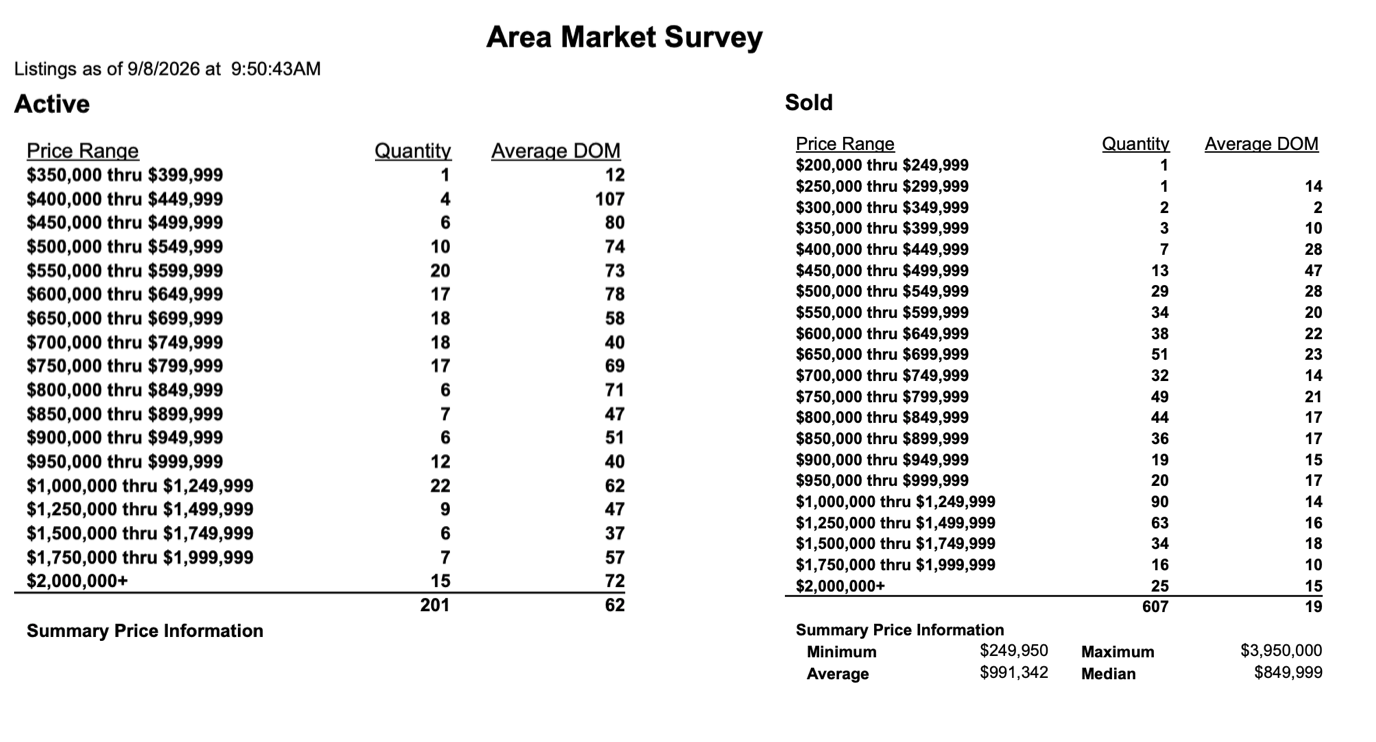
The biggest take away is a look at Days on Market for Active and Sold properties. Inventory is fairly high, compared to the past several years, and when you look at Days on Market for those Active homes they average 62 days. While homes that are sold average 19 days. There is typically a reason why a house stays on market. It is generally price, condition or location. But seeing the quantity of homes going under contract and closing, and the days on market at 19, shows that there are buyers out there. They know what they want and are willing to pay for it. If you are not meeting those expectations (price, condition or location) you might expect to sit awhile. We could even through in style of homes. Previously owned residential homes still seem to have a hotter market while Townhome and attached homes are lagging.
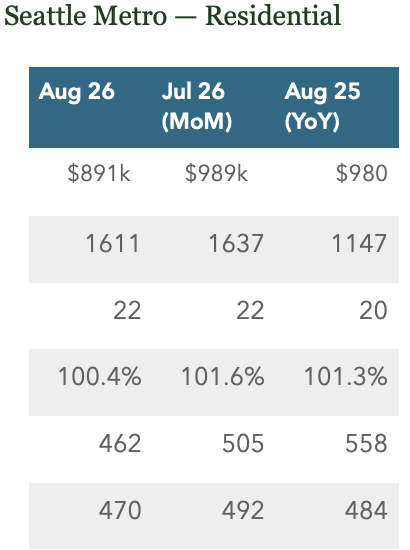
Seattle Metro numbers are similar to West Seattle. Lower median, slightly decreasing inventory, and lower closed sales. Pending numbers are off as well. We still have a ways to go this year but the trends show the market slowing and flattening.
September and early October markets can be fairly robust. For seller’s, the weather is still good and it’s light later so their homes can look their best. For buyer’s, there is more new inventory (July and August are slower New Listing month’s). But, we will see how the economic headwinds affect buyer and seller behaviors. It feels like this fall could be a little different from previous markets.