
May 2026 Market Update
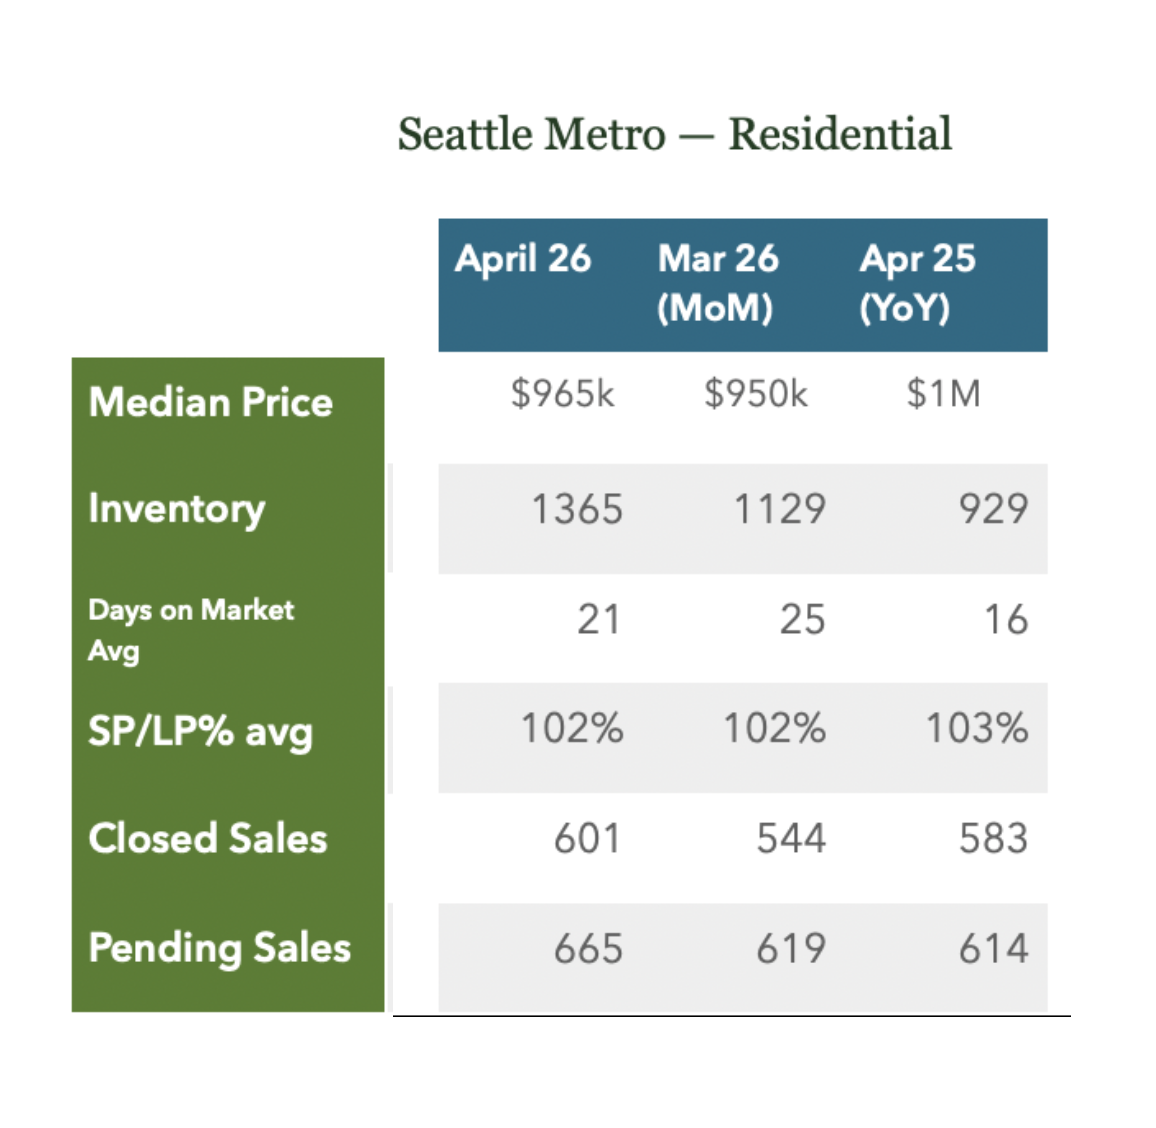
This is typically the time of year where we see prices start to take off. Prices are generally at their lowest point in January and start to rise as we get through the end of Winter and peak in late Spring. February through May is generally a time of lower inventory and higher demand. This market often has higher competition for homes sparking higher sales price/list price ratios and lower days on market. While, we did see improved month-over-month numbers in Closed Sales and Pending numbers the overall feel of the market was fairly even (or flat). Inventory saw an increase (which is fairly typical), Median Pricing was down Year-over-Year (and just a bit over the previous month) and Days on Market saw an increase. Homes are still selling, but not at the pace of previous April’s nor at the velocity of past years. 40 of the Closed Sales received over asking, 24 below and 38 at list. Last April, nearly half of the Closed sales received over List Price. The Closed sales may be more of a reflection of previous month’s Pending numbers (homes going under contract typically take 3-4 weeks to close) but does seem to indicate a slower Spring Market.
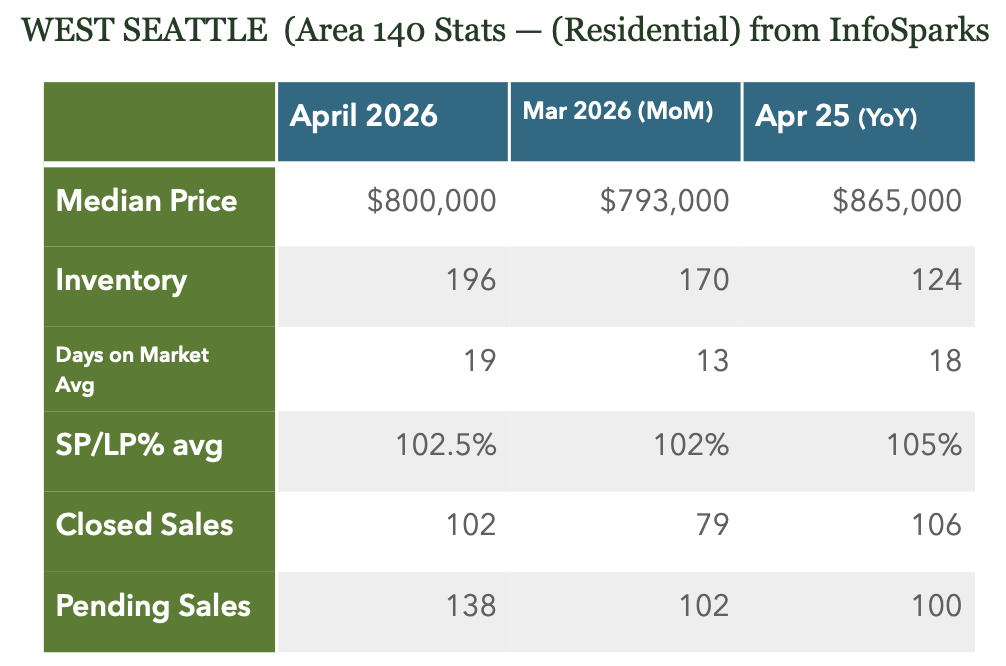
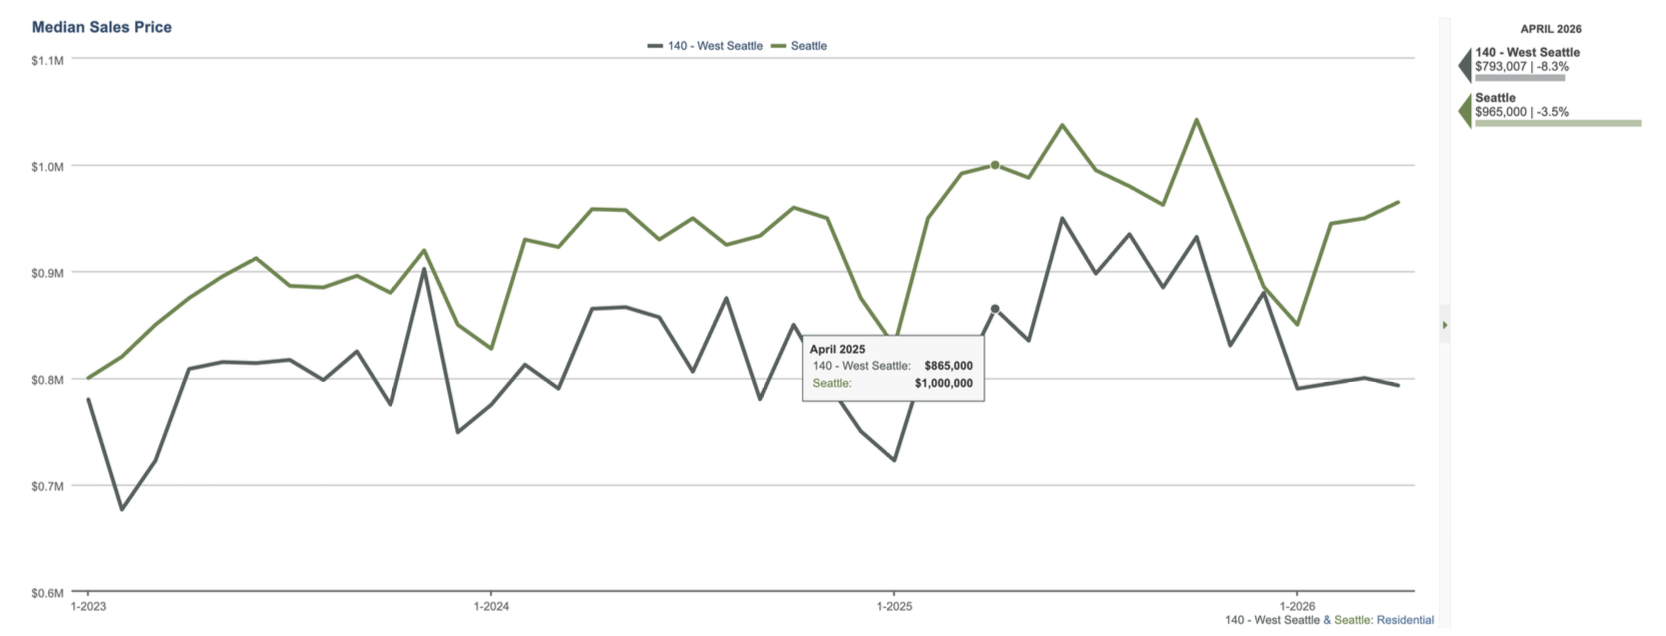
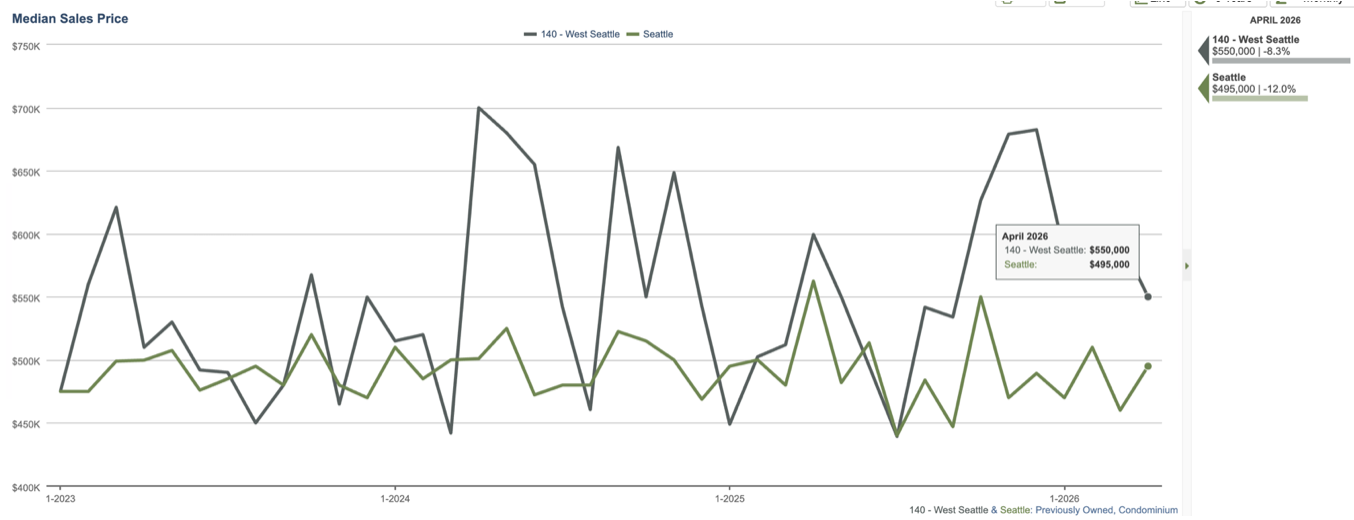
Median Price actually dipped last month. While not totally uncommon for peaks and valleys month-to-month in Median, it is significant that there are 4 straight months of flattening pricing. We still have a month or so in the Spring Market so it’s not over yet.
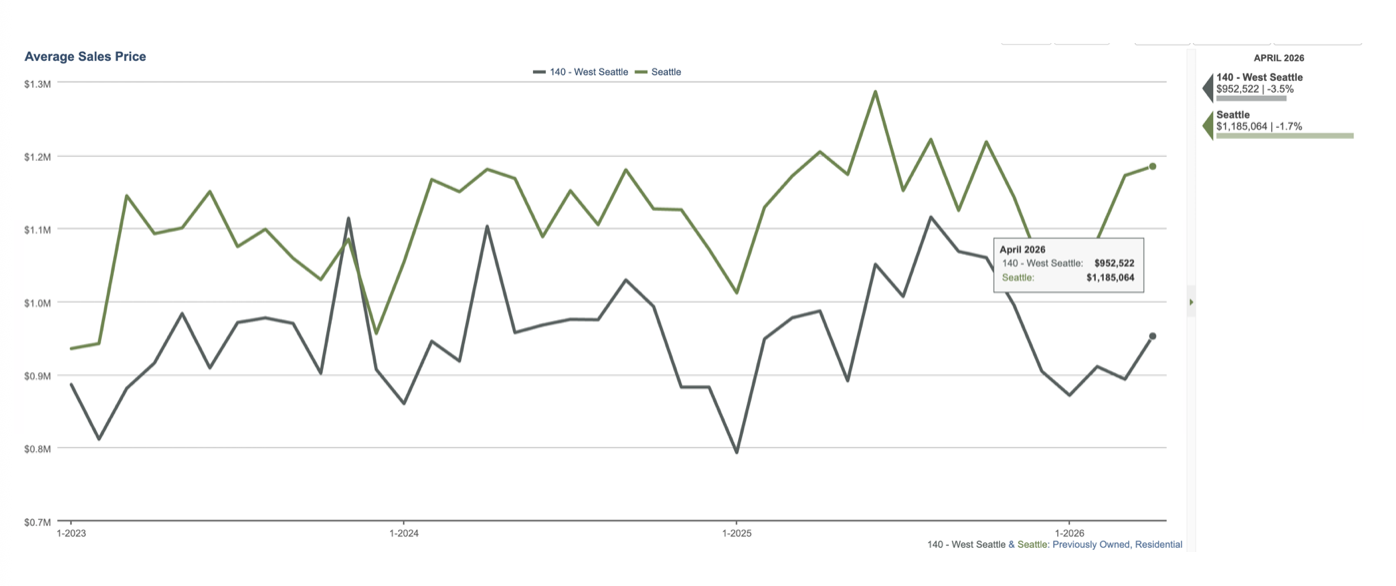
Average Pricing was up, likely indicating the higher tier homes are selling better and the lower tiers not as much.
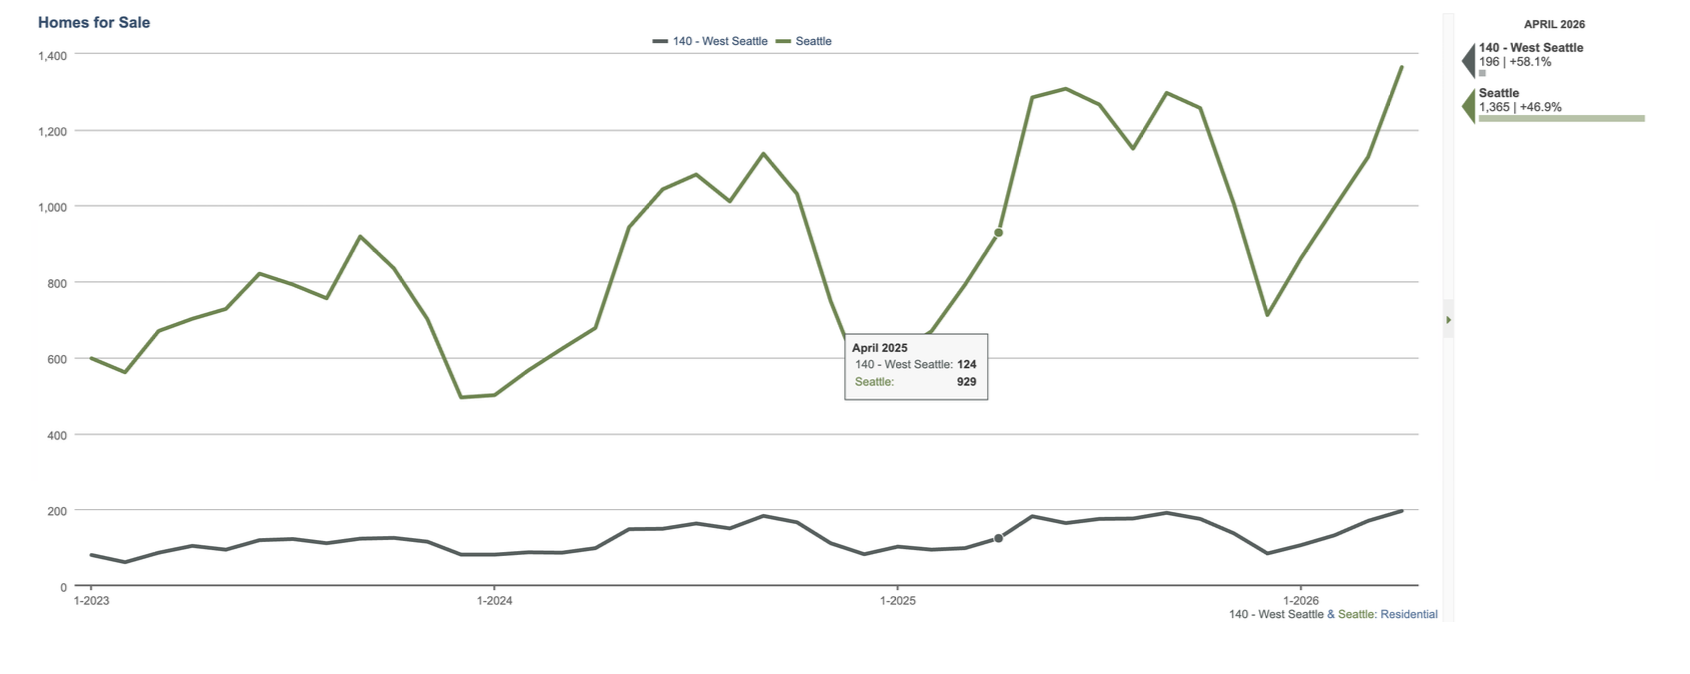
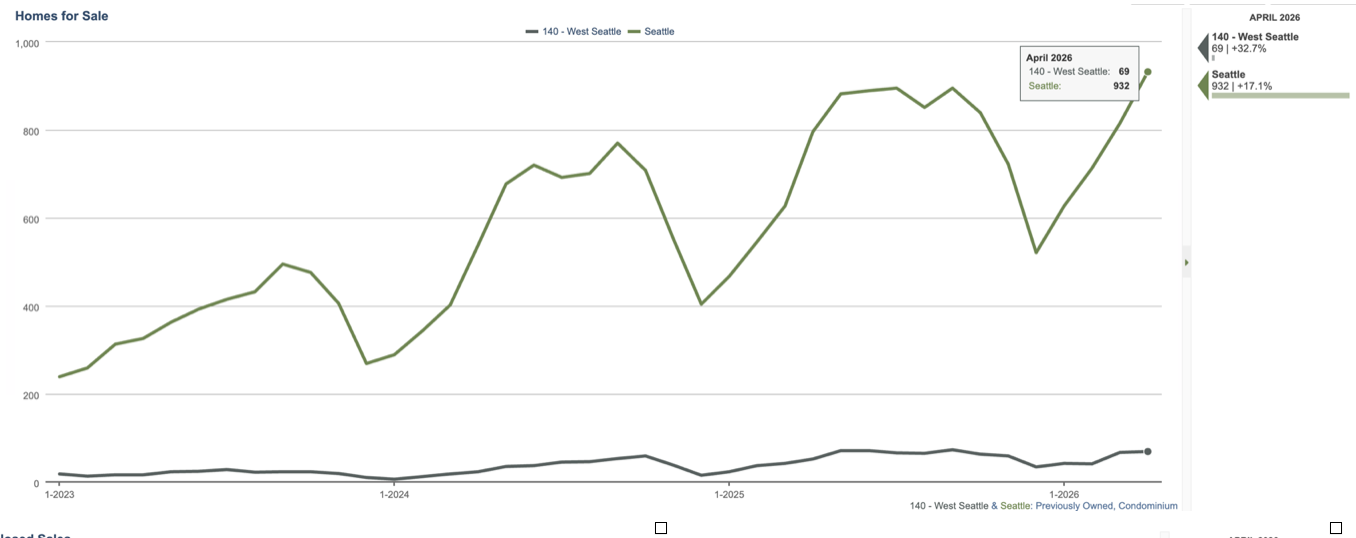
This is typically the time of year where inventory numbers start to rise. We generally see more homes come out after Spring Break (early this year) and towards the end of the school year (just a month a way). Homes are strategically listed this time of year (homes look better in the spring, more buyers are out and many people have plans during the summer and want to get a head of that). We did expect more homes to hit the market earlier this year in planning around the FIFA World Cup, but will have to wait a couple of months to see if that happened.
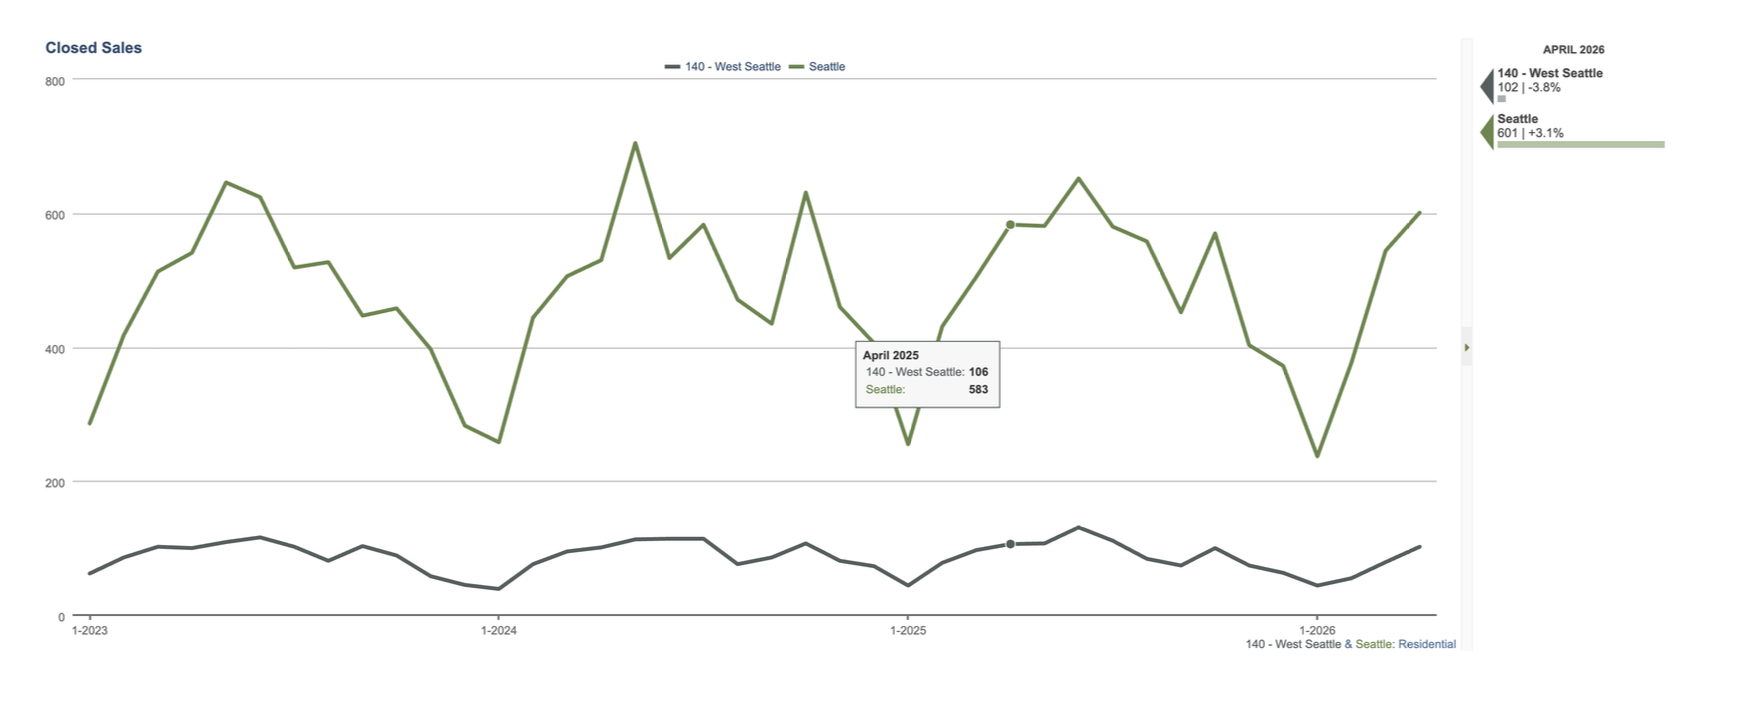
Closed sales were up MOM and about where they were a year ago. May-July are generally peak months for closed sales. 58 of this sales were on the market a week or less.
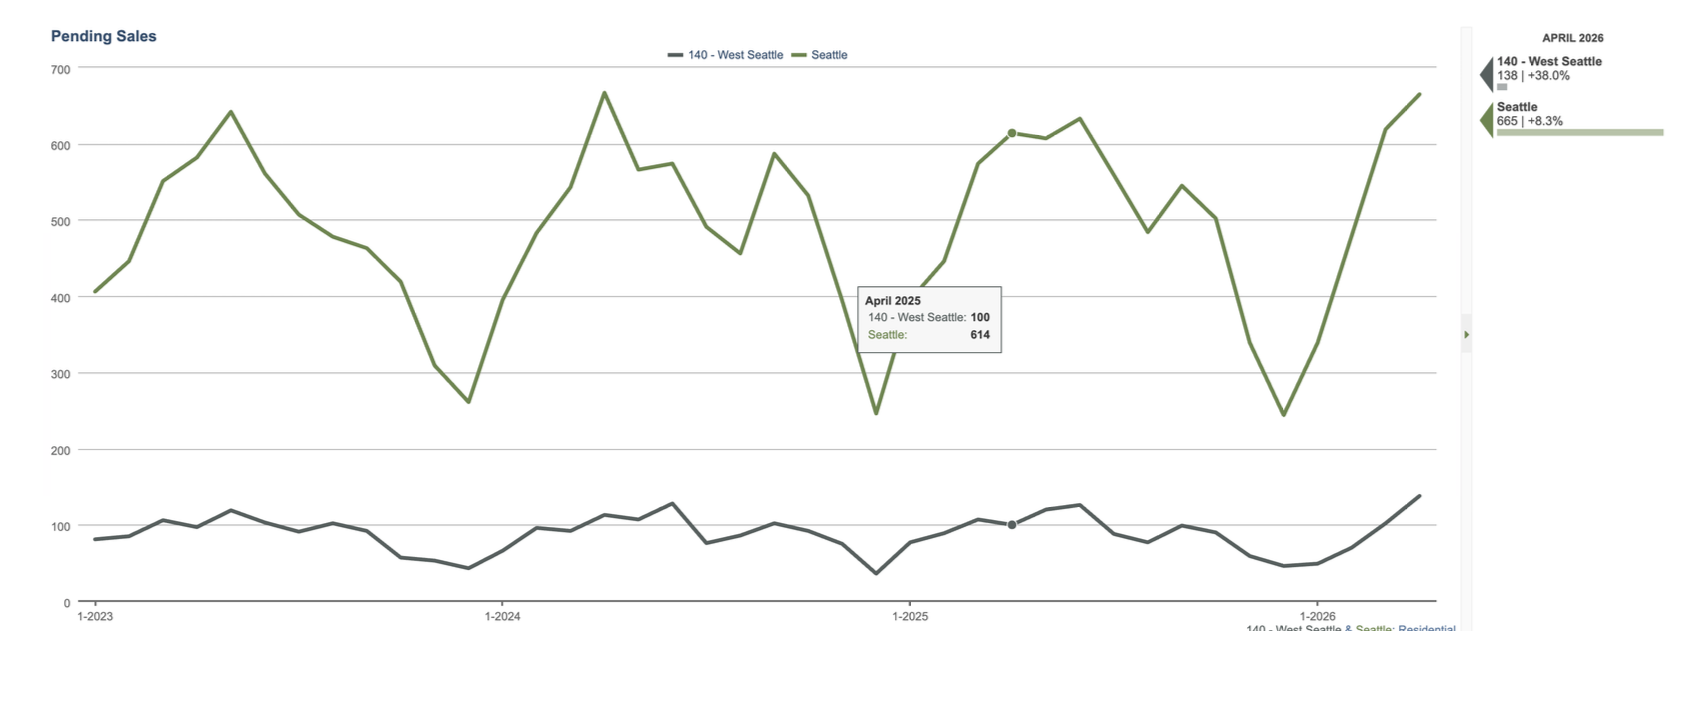
Pending numbers improved and show a bright spot in the numbers. At 138 homes going under contract in April, that is better than March or last April.
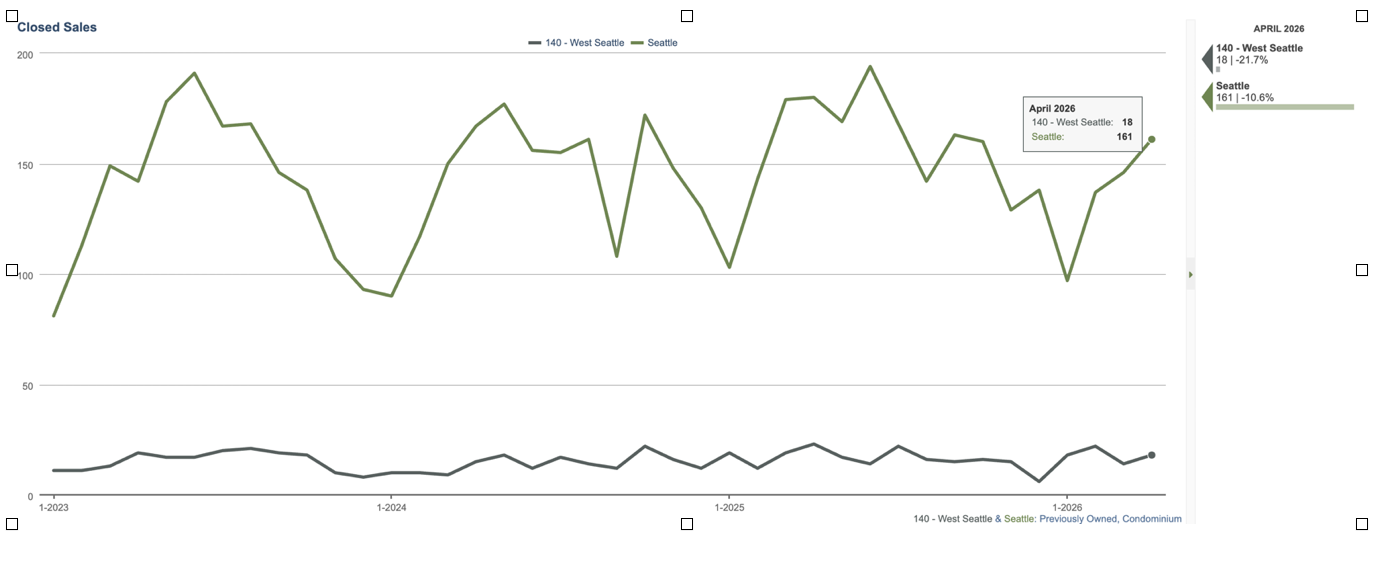
Condo Market -
We look almost exclusively at Residential numbers to track market health. But how about Condos? Condo numbers can get a little skewed in today’s market, as many of the 3-pack new construction homes are classified as condos (A major trend in residential areas involves building multiple "detached" units on a single lot, which are technically sold as condos to bypass lot-split restrictions). We parsed out New Construction and looked at just Previously Owned Condos. Median pricing has many peaks and valleys and a luxury unit may sell, influencing a particular month.
There are currently 69 Previously owned condos available, and 24 Pending and 18 Sold (in April). Days on Market was 36 for those sales and they closed at 98% of list.
It is more of a challenge to sell a condo in todays market, but that market segment is holding on.
Seattle Metro followed West Seattle numbers (or vice versa), as we saw seasonal rises in inventory but flat pricing. Increases in Closed Sales and Pending numbers show typical Spring Market indicators.
Interest rates have been low to mid 6s most of April and where at 6.4% this am (5/5).