
October 2026 Market Update
The Fall housing market can typically be the second most active of the year. People are back from summer activities, the weather is still good and we can see new inventory and more buyers. September’s numbers were up from the previous month and on par from a year ago. Inventory is building though and West Seattle hasn’t seen this many homes on the market since September of 2018, when inventory was over 300 residential homes (Seattle Metro had a huge jump and matched inventory levels from Fall of 2011). New Construction projects make up about 20% of that number. With Inventory up and Pricing mostly flat, the market is more balanced.
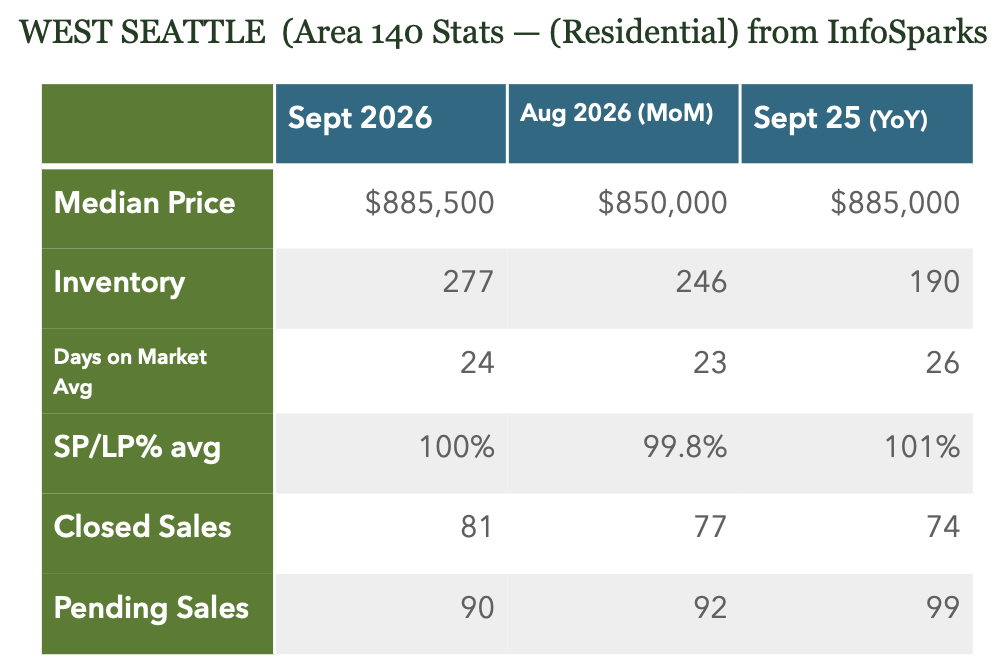
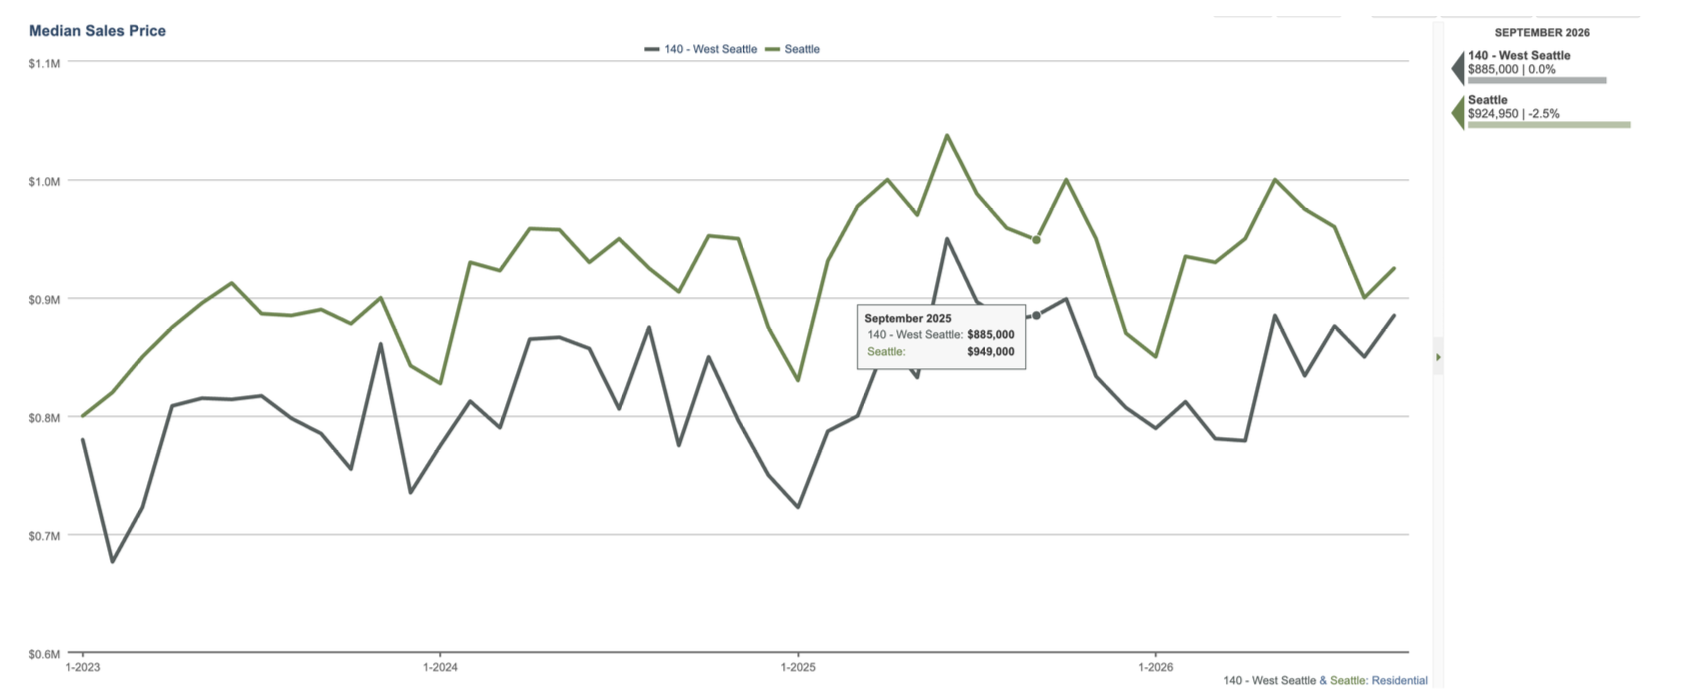
We typically see bumps in Median price in Fall (September and October) and this year was no different. Sellers typically wait to put their New Listings on after Labor day vs. July and August (when many buyers may be away). 26 of the 81 closed sales had list price/sales price ratios of over 100% (meaning competitive situation), and 36 had final sales prices under list.
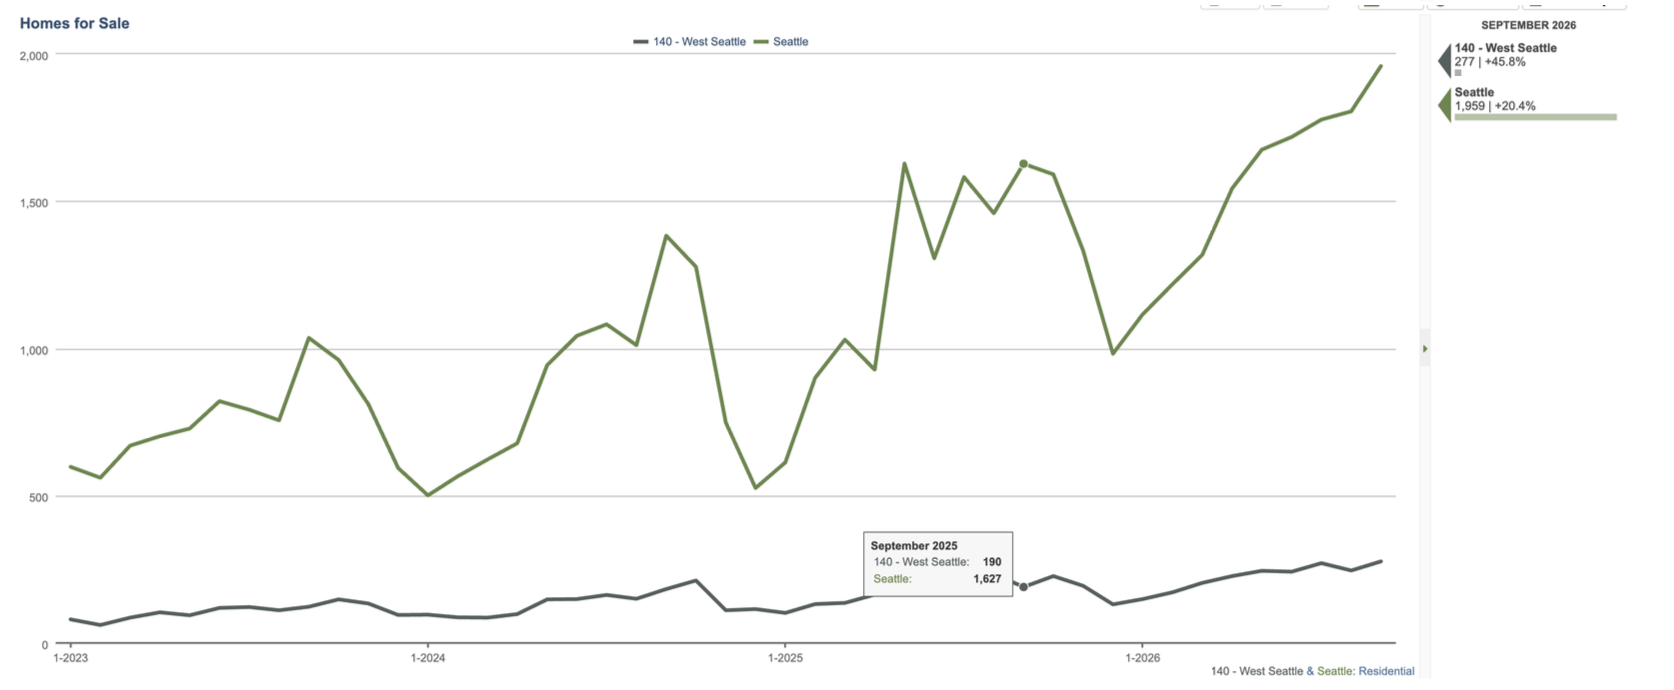
Inventory continues to climb. It’s hard to see in the below graph as it compares with Seattle Metro but the average amount of listings in WS is the highest since 2018. West Seattle saw 172 New Listings in September vs. 118 in August.
Inventory levels haven’t been this high since the 2018-2020 (Covid) markets. The Median in September of 2018 was 692k. I don’t see more inventory leading to pre-coved pricing levels but just an interesting look at a 10 year Inventory levels. The below graph just shows West Seattle inventory numbers.
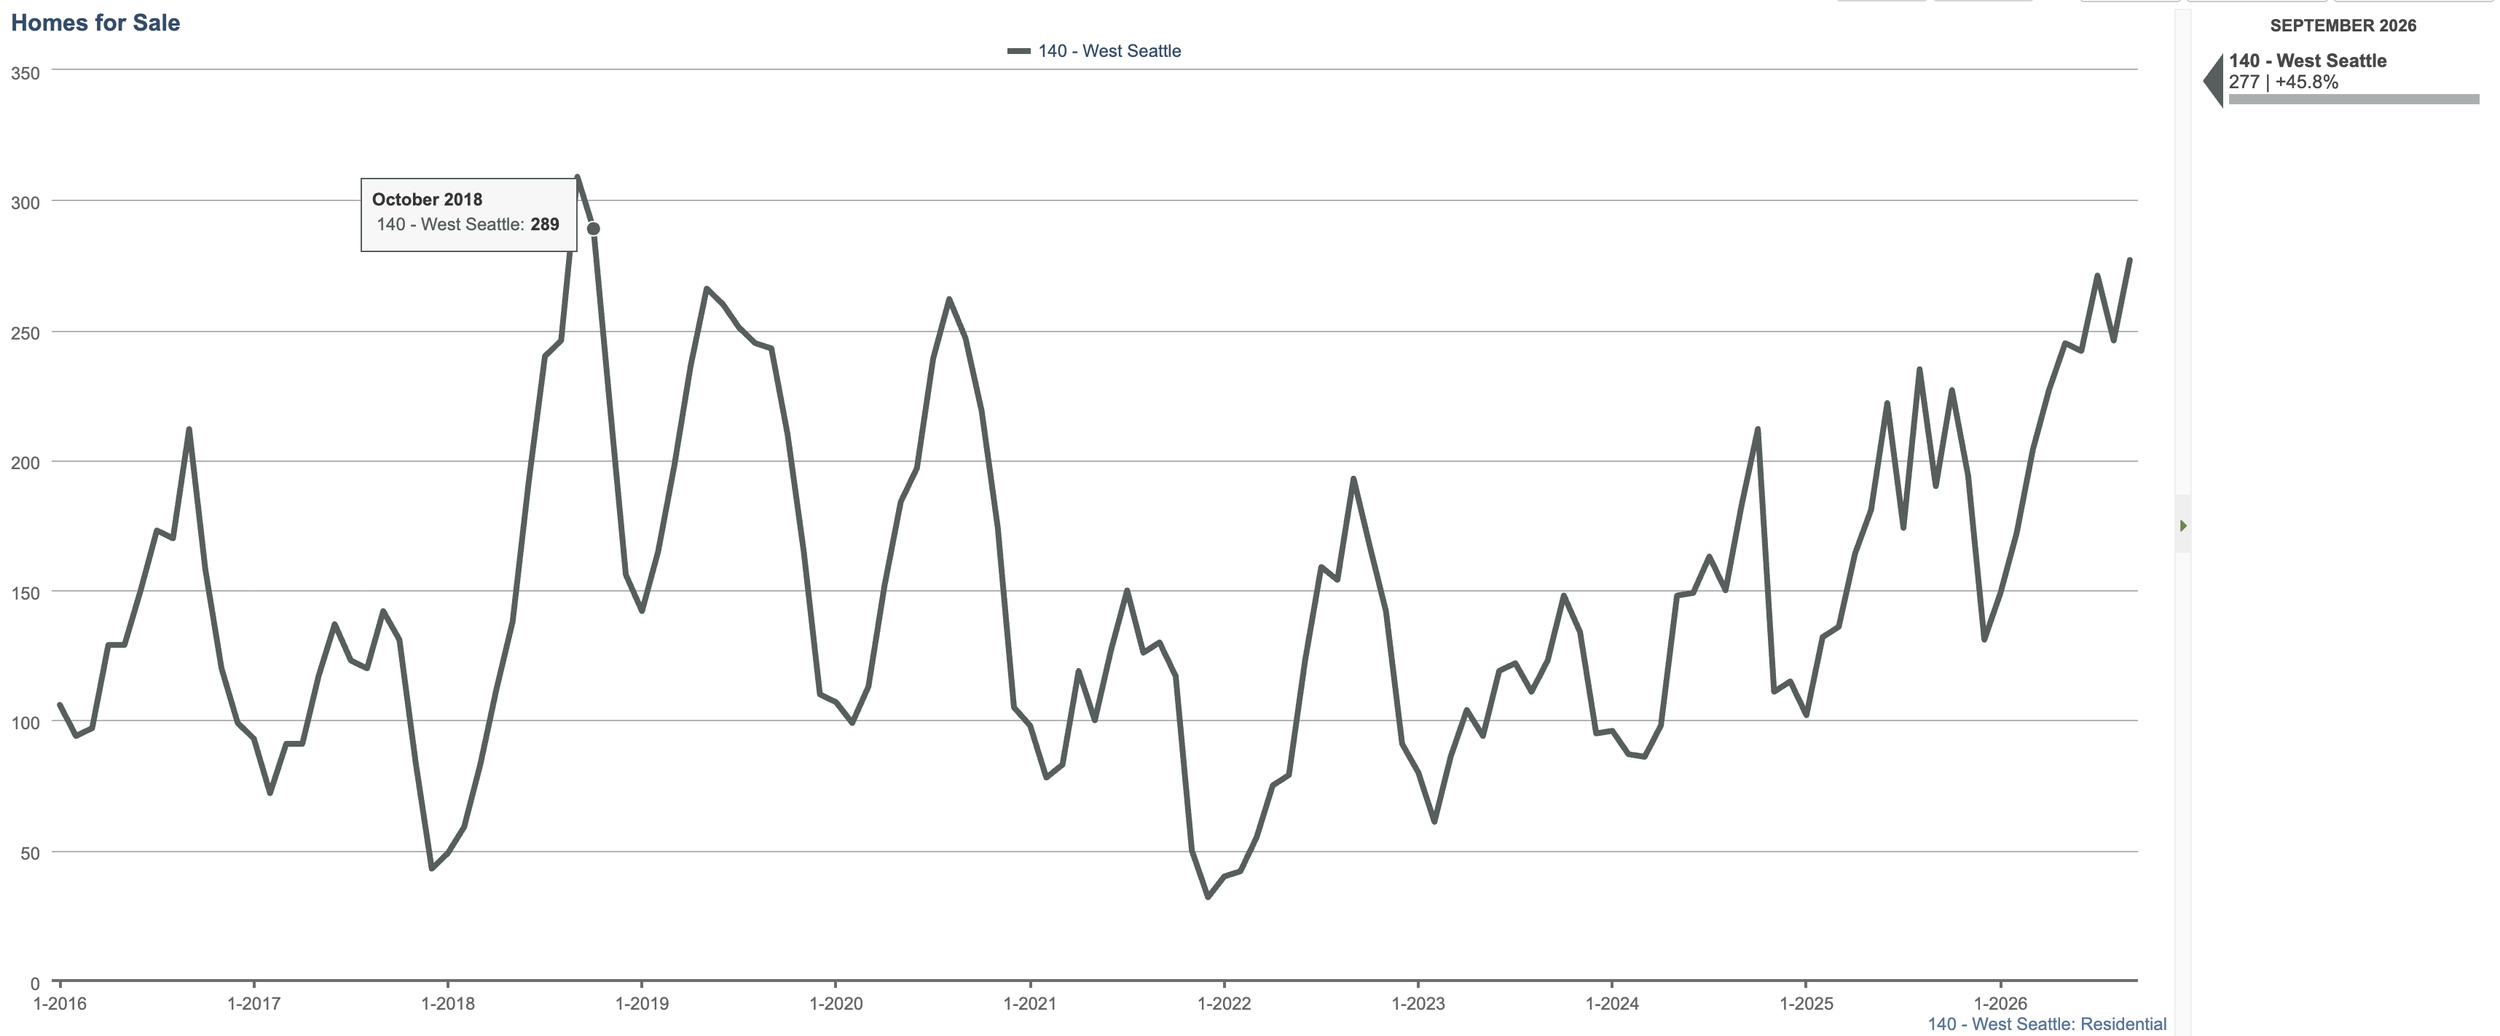
West Seattle Inventory levels past 10 years
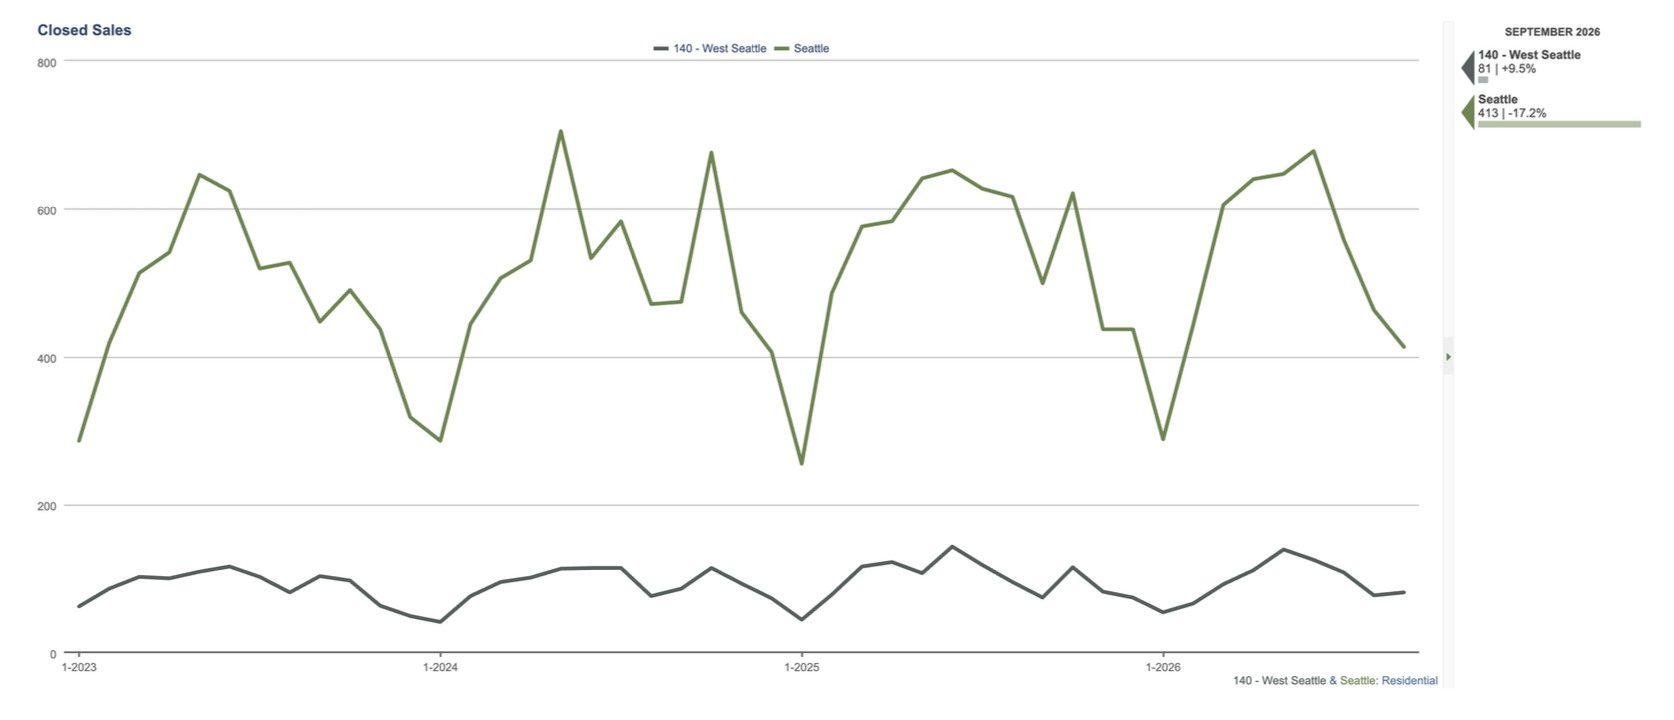
West Seattle saw a slight tick up in Closed Sales last month but not the typical spike of previous Fall markets (which were near yearly peaks 2023-25). Higher interest rates (7.5% today) are taking a toll on sales, especially in lower price ranges. The Average Price in West Seattle last month was $1,010,000 indicating most of the activity was in higher price ranges. 28 of the 81 closed sales were for over 1M, including 2 homes over 3M.
Pending numbers were flat last month. Closing can take less than 2 weeks in this lending climate so might not show falling activity (just quicker closings). One month doesn’t make a trend so we will track this over the next couple of months. We kind of expect numbers to drop off a bit, partly seasonal and partly market driven. Typically we see more Pending sales in September and October and then drops November-February. Interest rates have been very volatile the past couple of months and have dampened buyer activity.
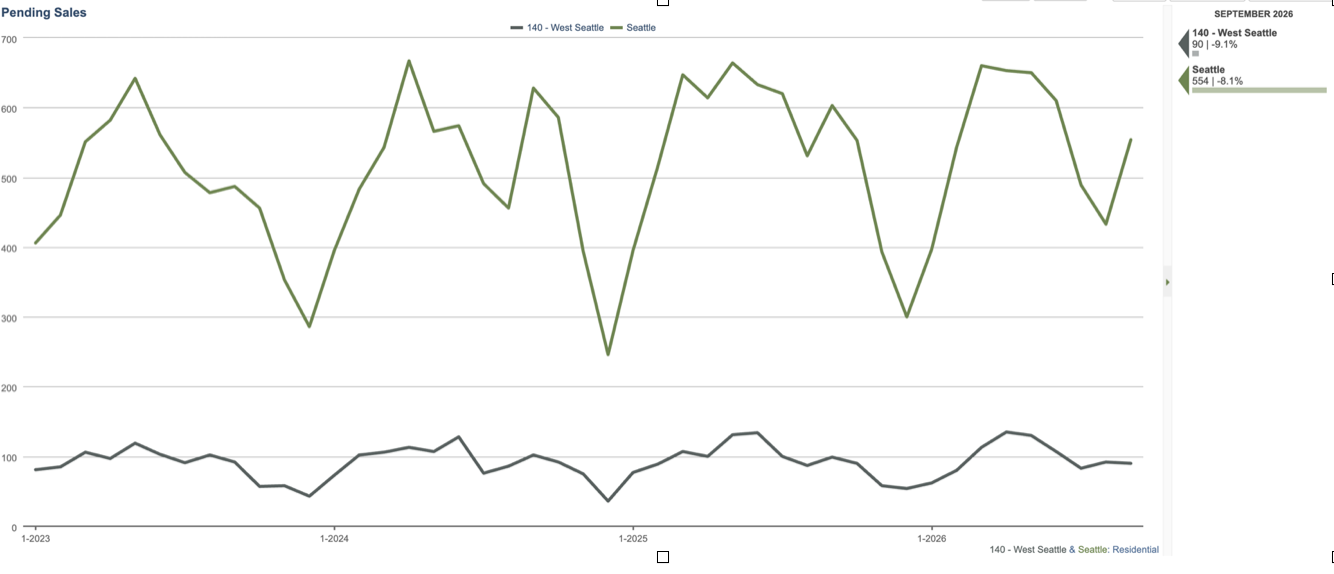
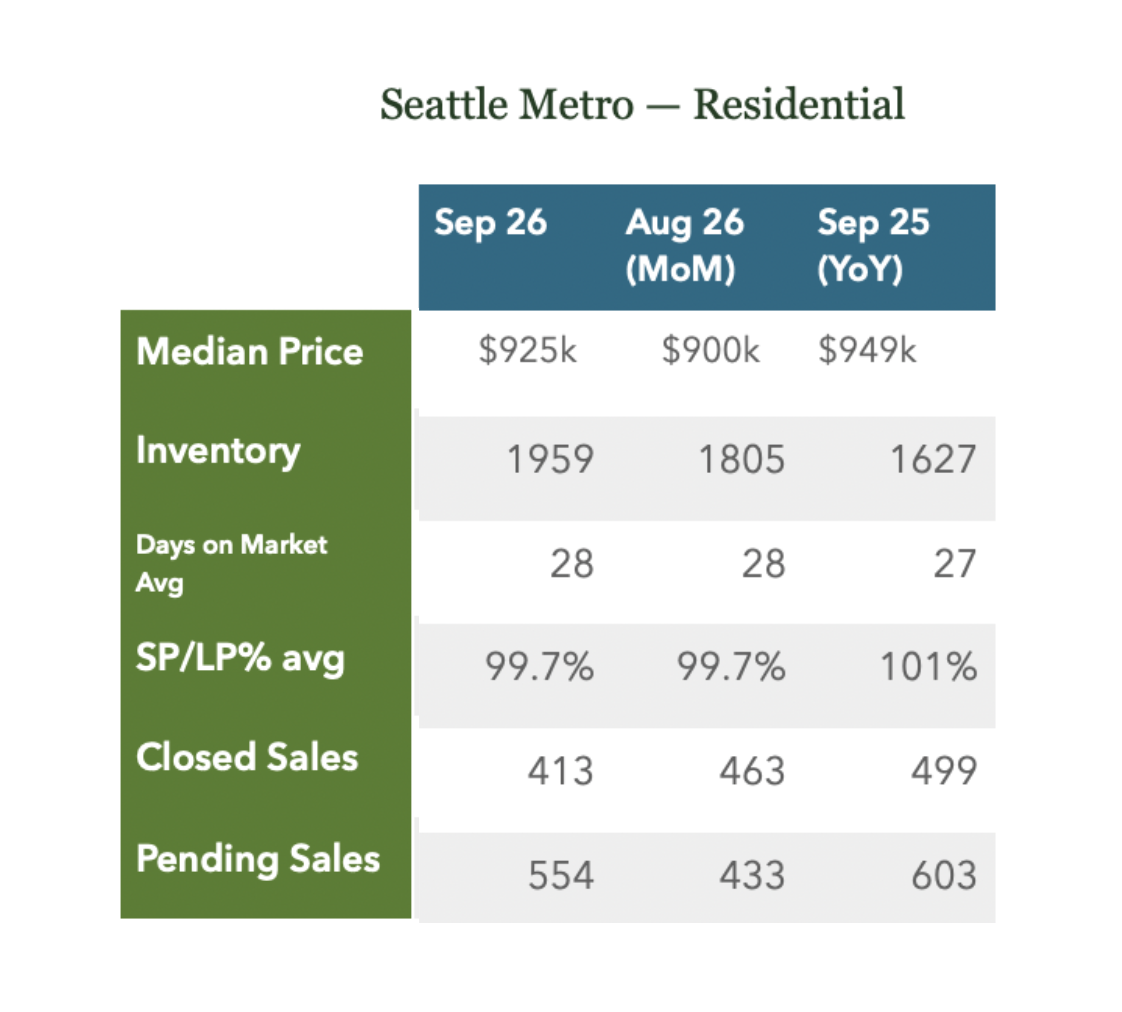
Seattle Metro trends showed some mixed signs. Median was slightly up, Inventory levels not seen since 2011, lower Sales Price/List Price ratios, lower closed numbers. Pending numbers were up MoM but down from a year ago. October numbers will probably be a better indicator of market health. I believe it mirrors the WS market, where higher price points are being fairly resilient and active and lower end price tiers (especially condos and townhomes) are not as active.