
Mid Year Review
We just crossed the mid way part of the year and West Seattle and Seattle Metro just saw their all time high in Median Price. West Seattle saw a big increase month-over-month and topped the 2 previous highs of 902k in September of 2023 and 930k in April 2022. Seattle Metro’s median was $1,037,000 in June topping previous highs of 1M in April of 25 and April-May 2022. Interest rates in April of 2022 were right about 5% and have been in the 6-7%’s ever since.

2025 has been off to a fairly good start. We typically see bigger price gains at the beginning of the year and this year followed the same trends. The Median in West Seattle, since the beginning of the year, is $850,000. There have been 554 sales so far which puts us about the same as the first half of 2024, when there was 538. But far off of the first half of 2022 when there were 819 closed transactions. Typical years are right in between, 1200-1300 total sales for the year.
We would say that certain price ranges are influencing the market. The 1-1.25M has been a major driver of sales with 83 in the past six months (there were 64 for the same time range a year ago). 1.25-1.5M has been incredibly active as well with 53 sales (compared to 54 in first half of 2024). The 700-800k range (typically the most active range) was about the same as a year ago, 95 in 2025 and 100 in 2024. So, it really looks like the extra sales (19) in the 1-1.25M are supporting the price increase.
Days on Market is 18, similar to 19 in 2024.
Sold Listing Activity per price point

Here is the most expensive house sold so far this year -

A typical home around 1.25M -

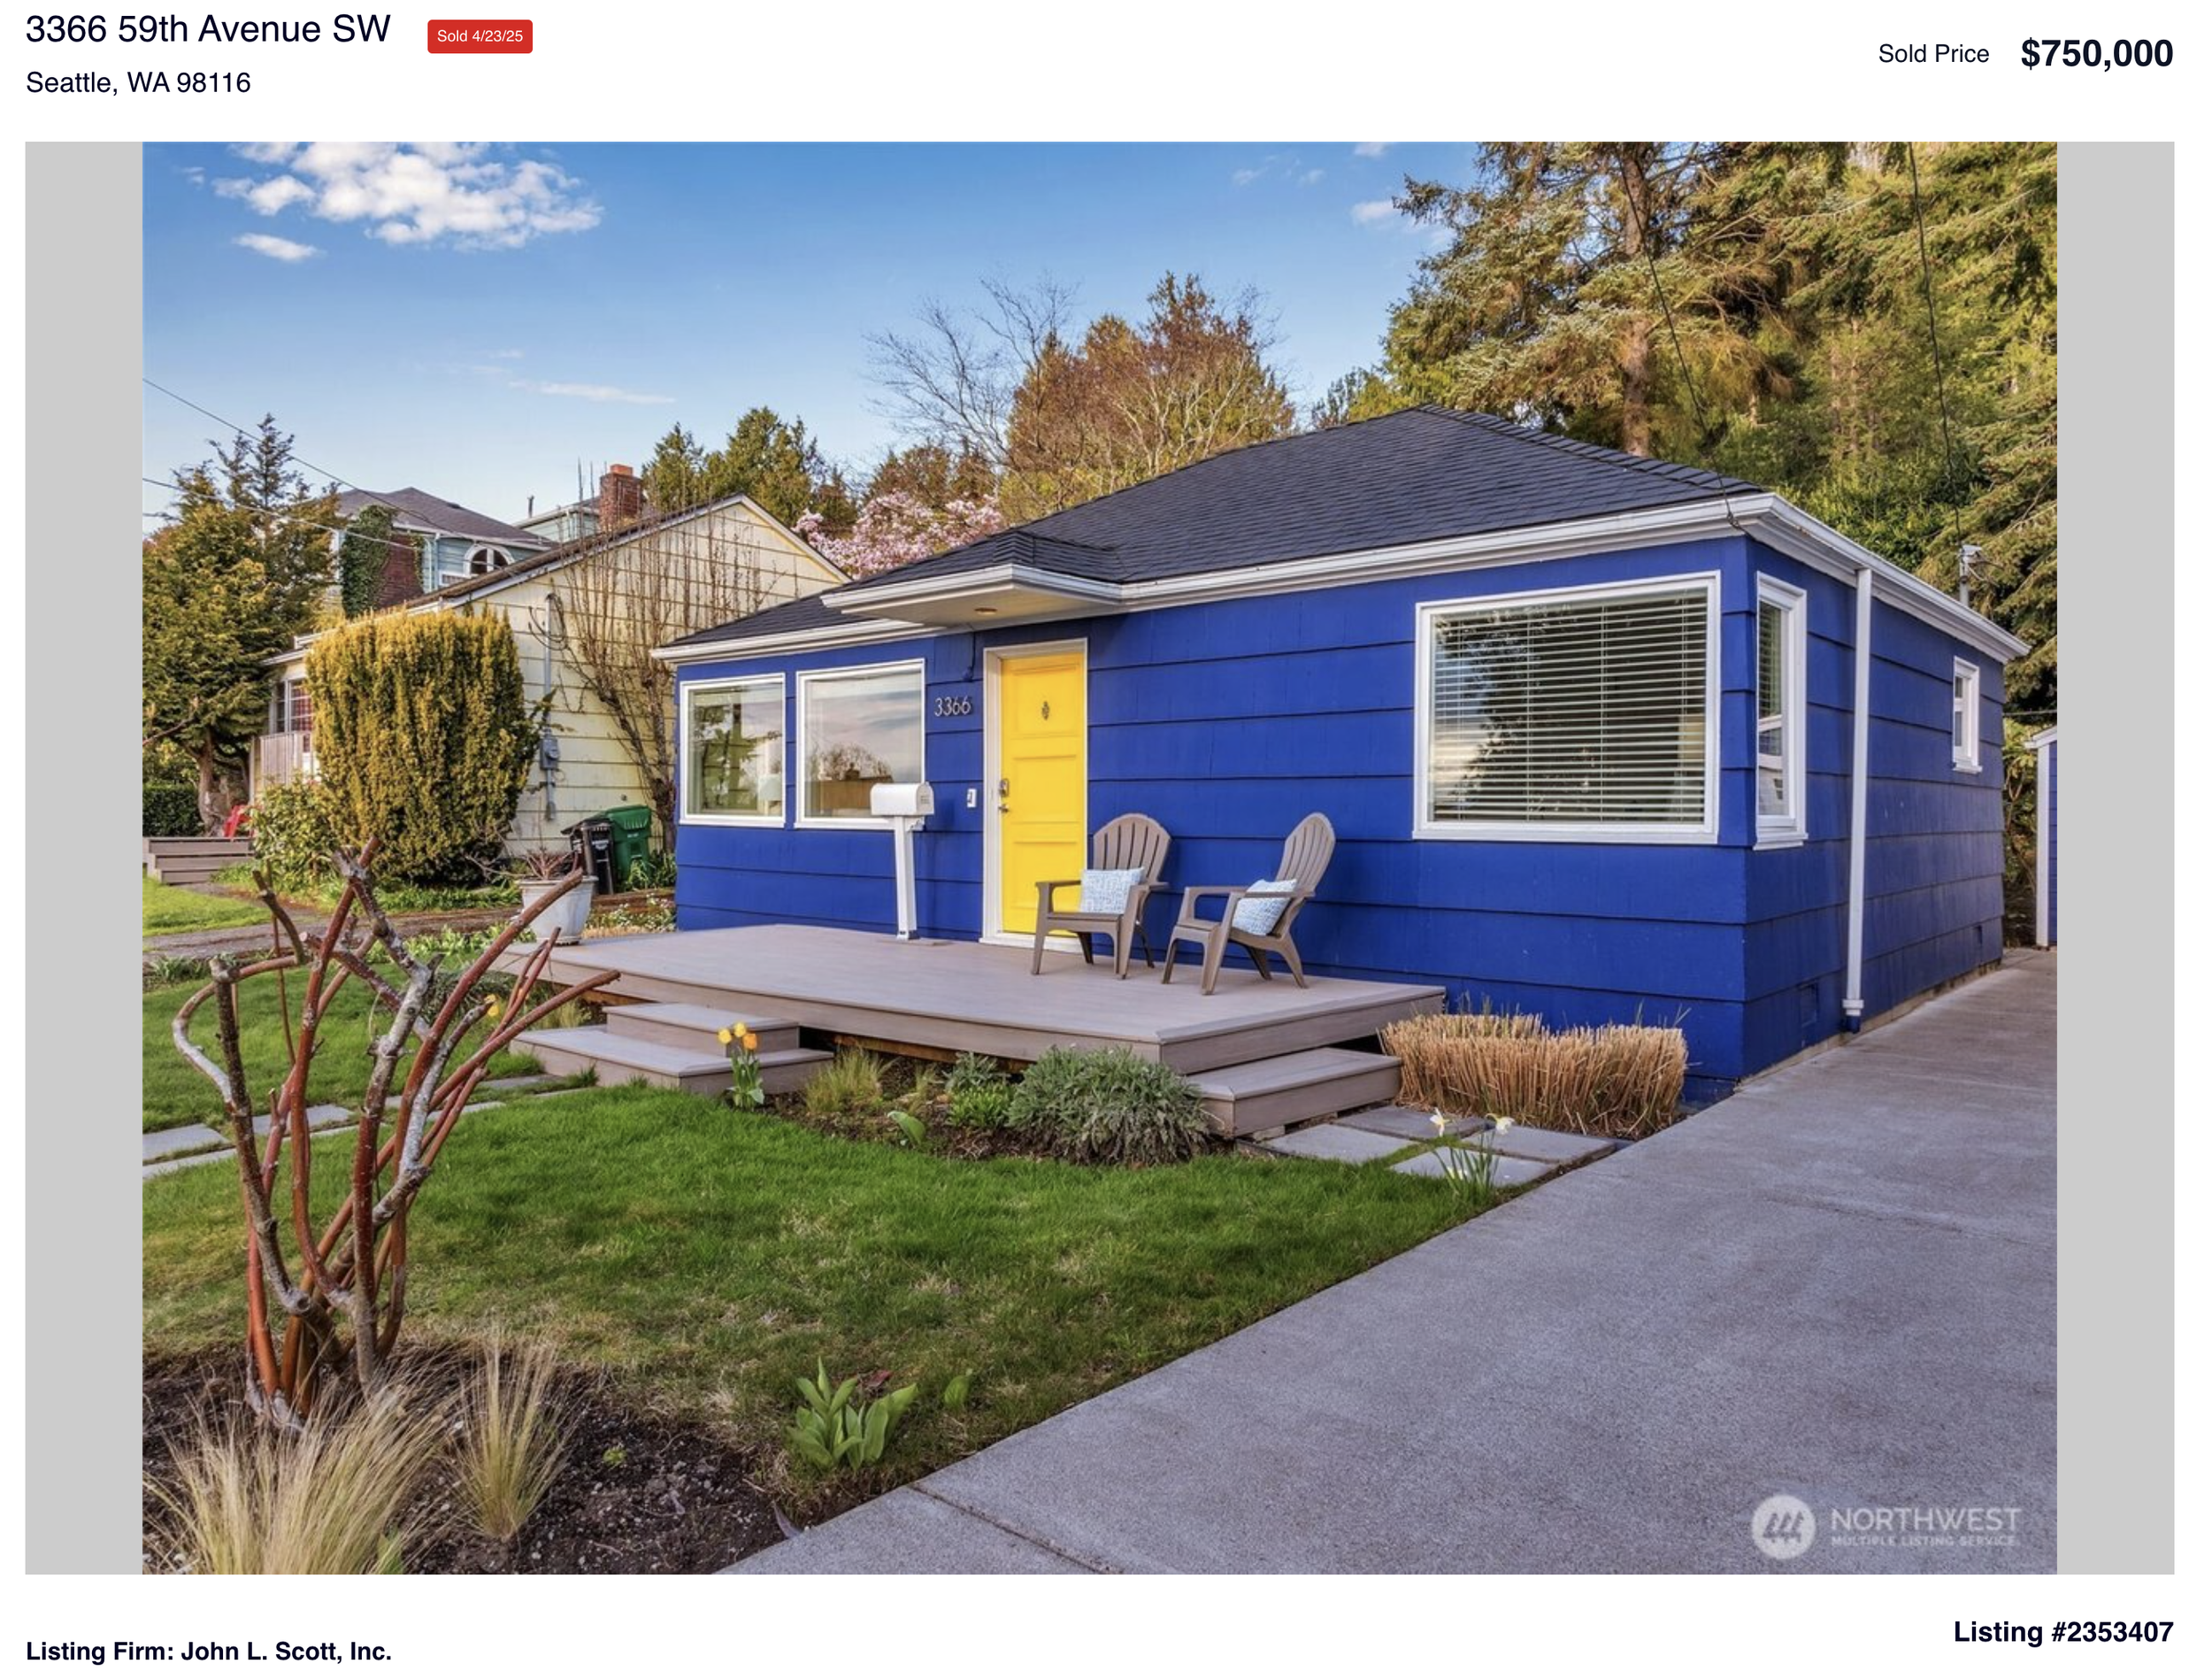
What you might get for 750k -
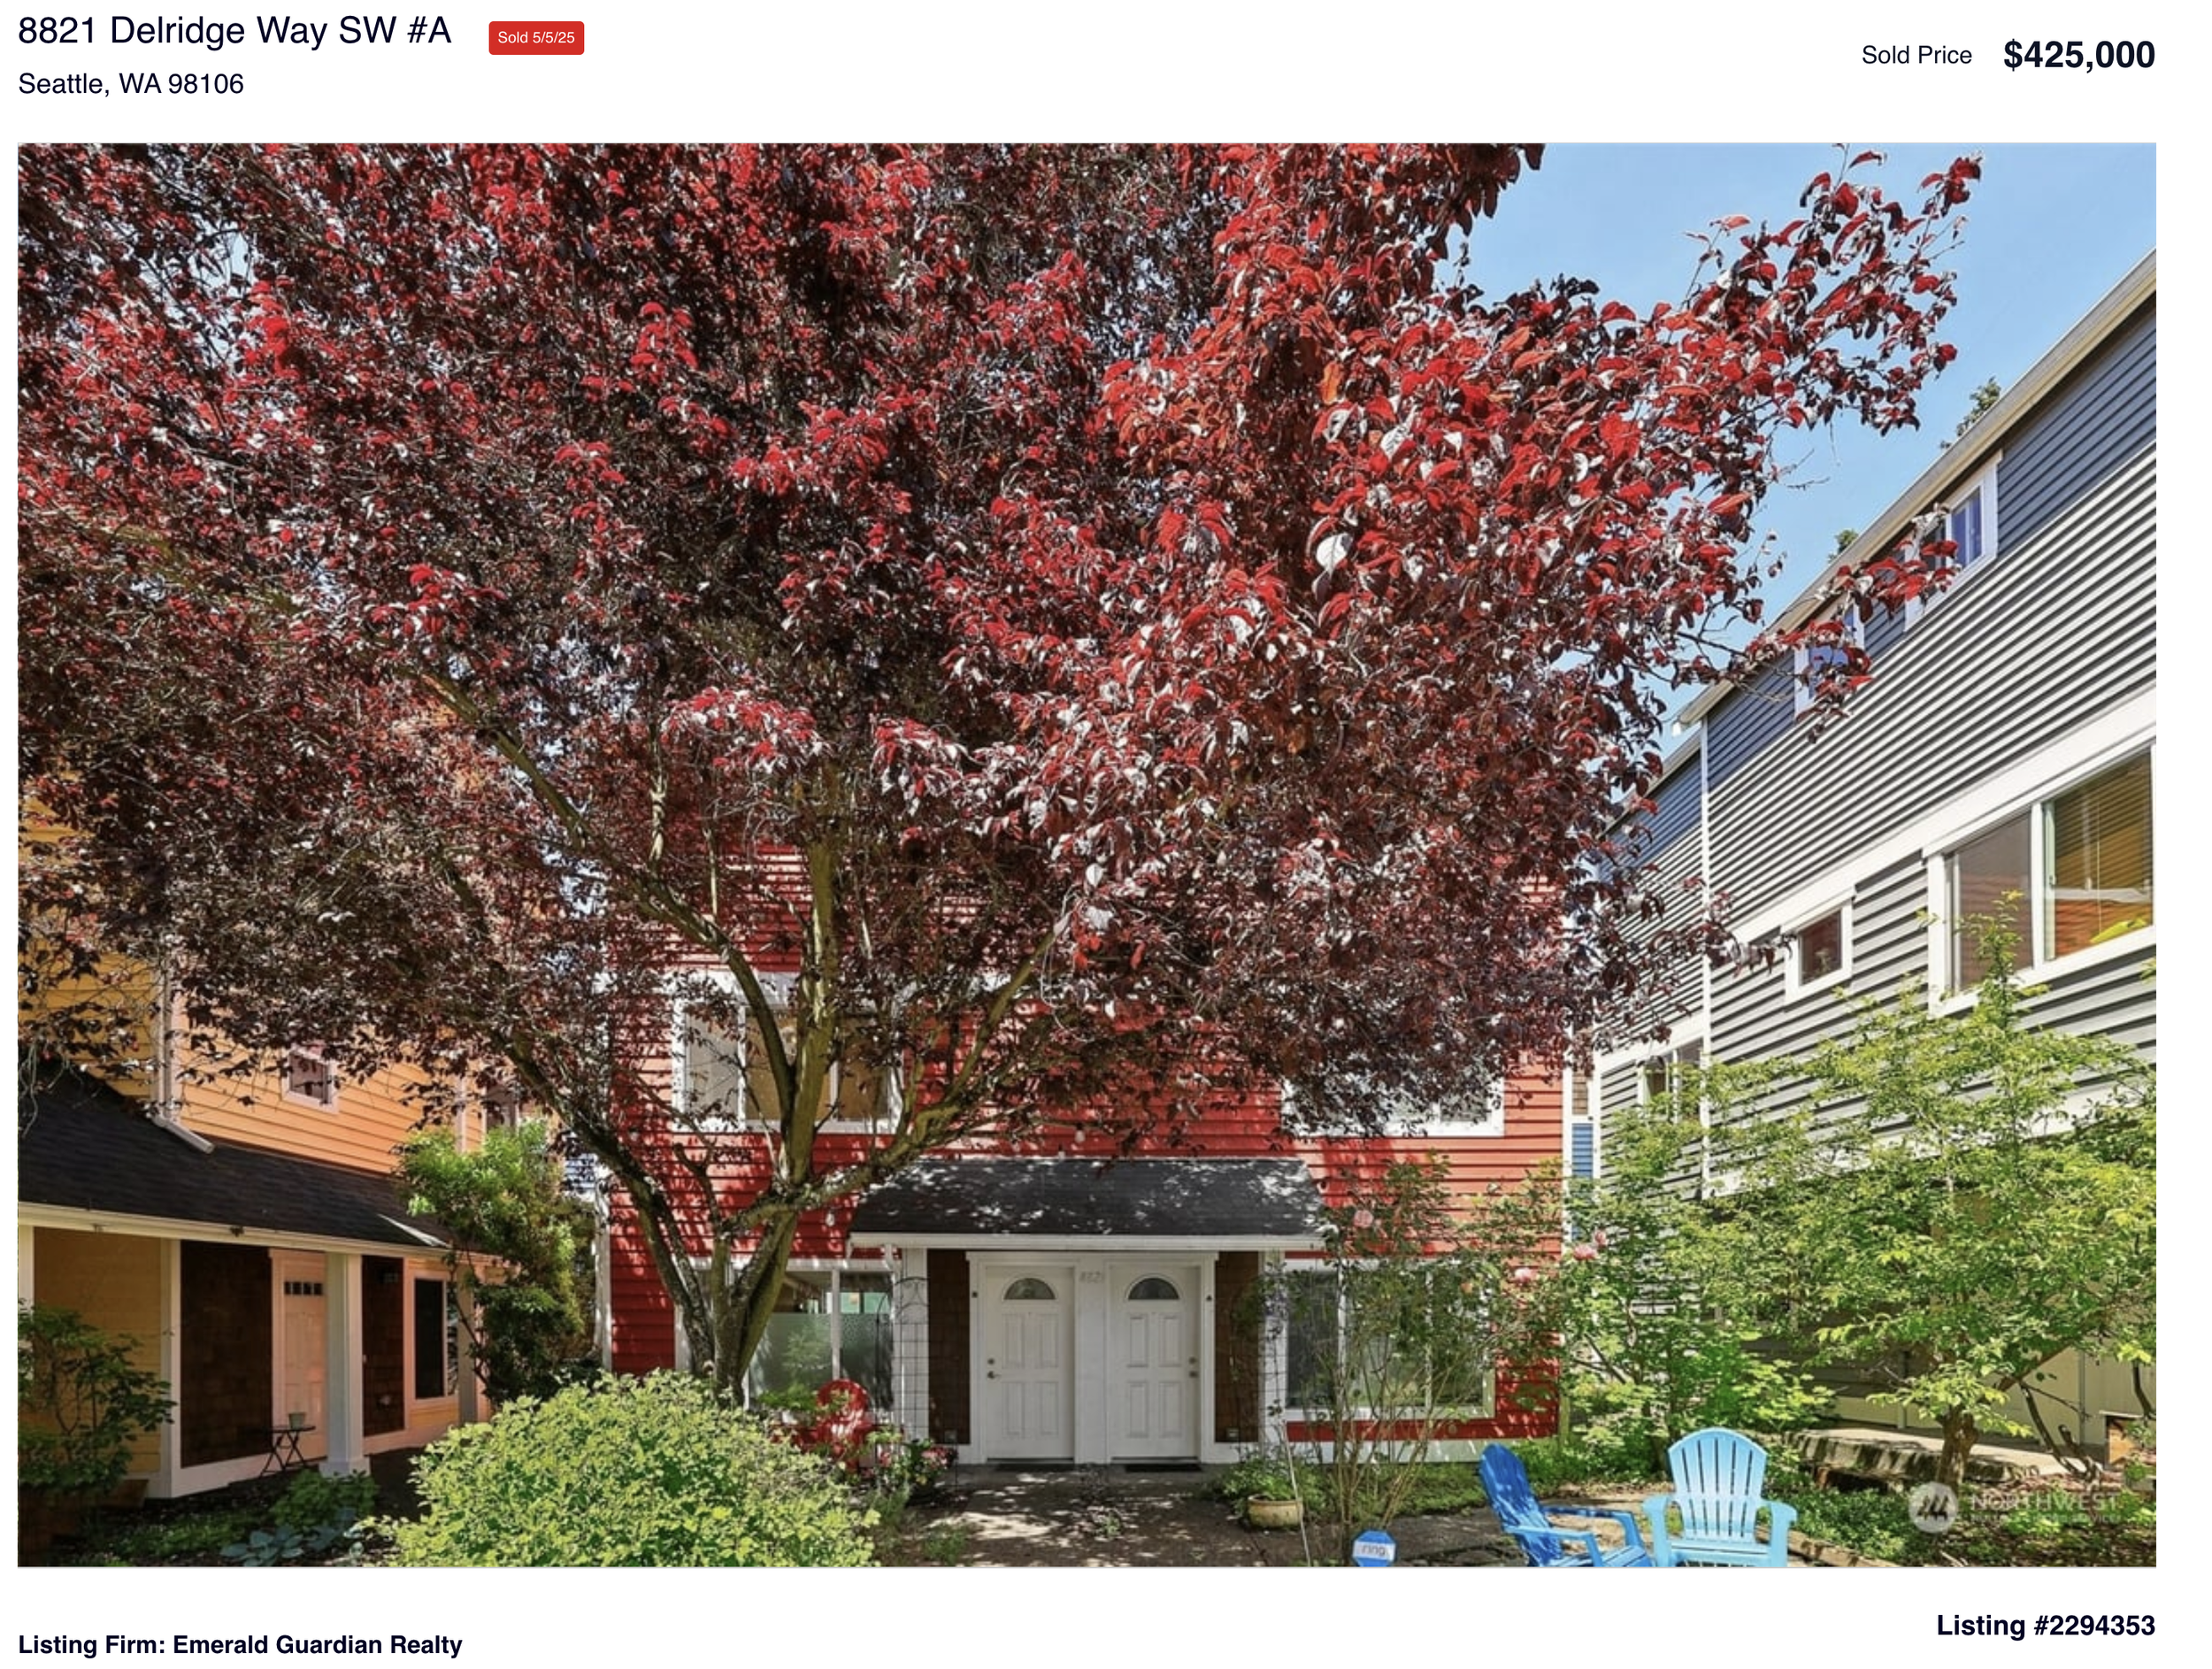
And there are homes for under 450k, here is one -
Inventory has started to build since the beginning of the year. There are about 190-205 homes on the market, average per week , compared to 149 last June. The last time there was an average of over 190 homes on the market for a month was September of 2022 when rates were getting into the 6’s.

Interesting to note, days on market for Active homes is 42 compared to 21 for sold properties. This might get skewed a bit as many Townhome or “condo/ADU/DADU” are priced in the 700-800k range where Days on Market is longer. Those projects can sit longer in this market.
Outlook for the rest of the year. So far, this year has followed seasonal trends. Lower inventory and higher median in the spring. The market typically peaks in April or May as more inventory hits the market and buyer urgency wanes. Spring Break was a little late this year (end of April) so the market may extended a little and peak happened in June. We’d guess that Median will level off or likely fade a bit and follow typical trends (July and August can be a slower market). September and October would be the next expected selling portion of the season and we think inventory should grow a little but prices likely won’t drop much. So far, buyers have acclimated to the higher interest rates. At least those buyers in the higher price ranges. We’d guess more of the same for the time being.