
October 2025 Market Update
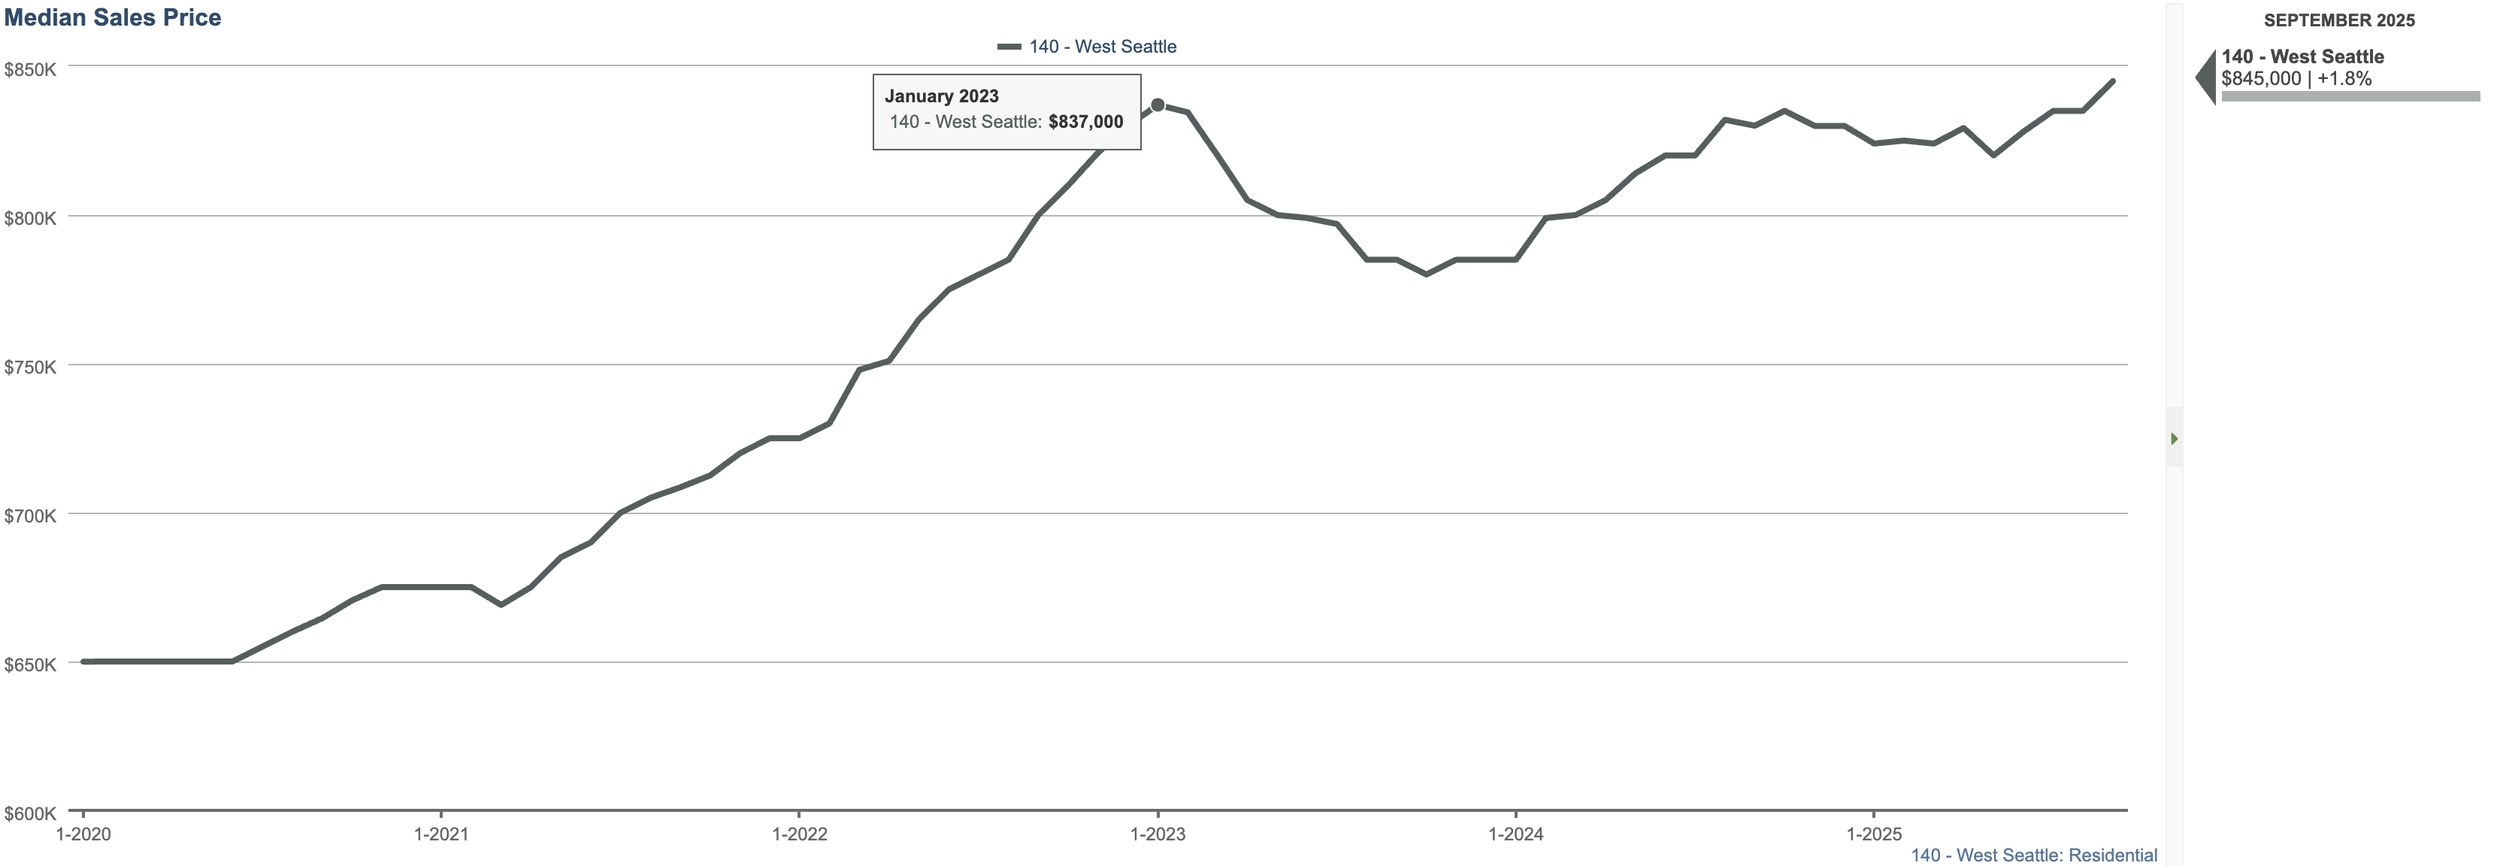
September’s numbers are in and show mostly seasonal trends. Typically, prices peak in Spring then level out in summer and then bounce a bit in fall during the second selling season before tailing off at the end of the year. The beginning of fall looks to be following suit.
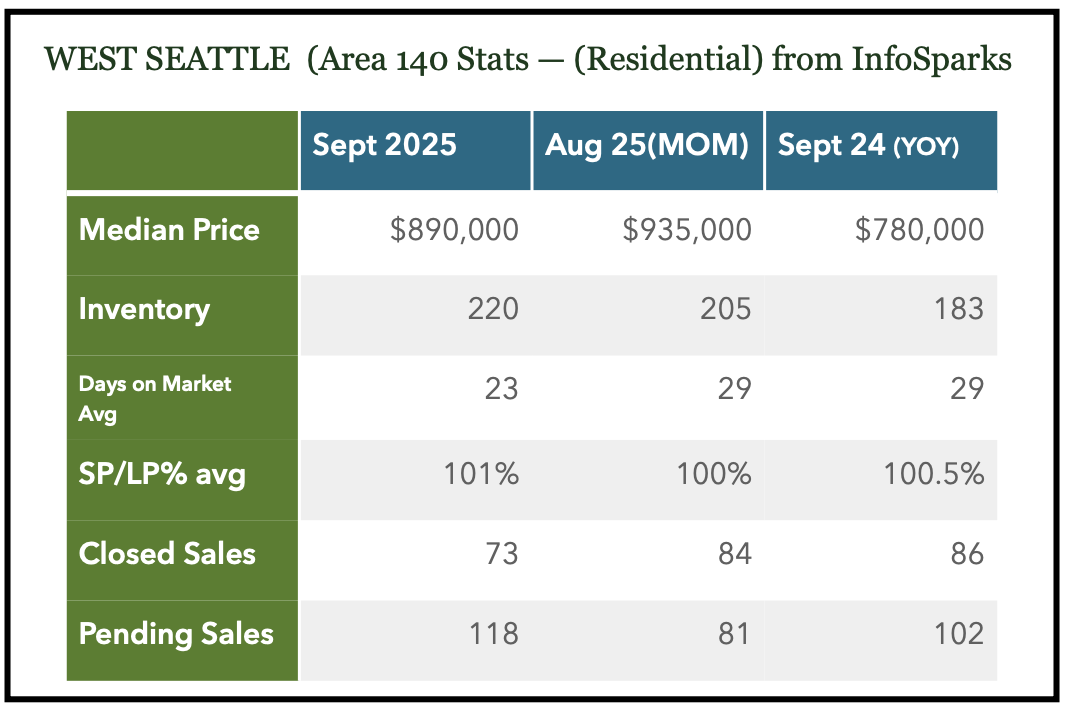
Median Price, in West Seattle, did dip to 890k from August’s 935k but that month was influenced by the two highest closed sales of the year. While the West Seattle market is not as brisk as busy spring months, only 73 Closed sales, the higher Pending numbers (homes going under contract) at 118 cemented early fall as being a second selling season. Sales price/list price ratios were still above 100% but we did get a sense that there is more movement in pricing. 20 of the 73 Closed sales sold for over 100% of list price, 27 sold for less and the rest were just around list (but some might have had a concession). Inventory is up at about 220 homes available on the market every week. We typically see the highest amount of inventory this time of the year. As mentioned, early Fall can be a second selling season and had 167 new listings hit the market last month (up from 116 in August and 137 in July).
Median price has bounced up and down the past several months but remains fairly high. Average Sales price was at $1,069,000 last month indicating the higher end market is influencing this number. 35 of the closed sales last month were for over 1 million dollars.

Each data point is one month of activity
We can also look at Median in a rolling 12 month pattern (vs. the above monthly data point). Looking at this way softens the big up and down spikes and can offer a larger point of view. It shows prices have had modest gains but have leveled off compared to the huge increases as seen between 2020-2023.
Each data point is 12 months of activity.
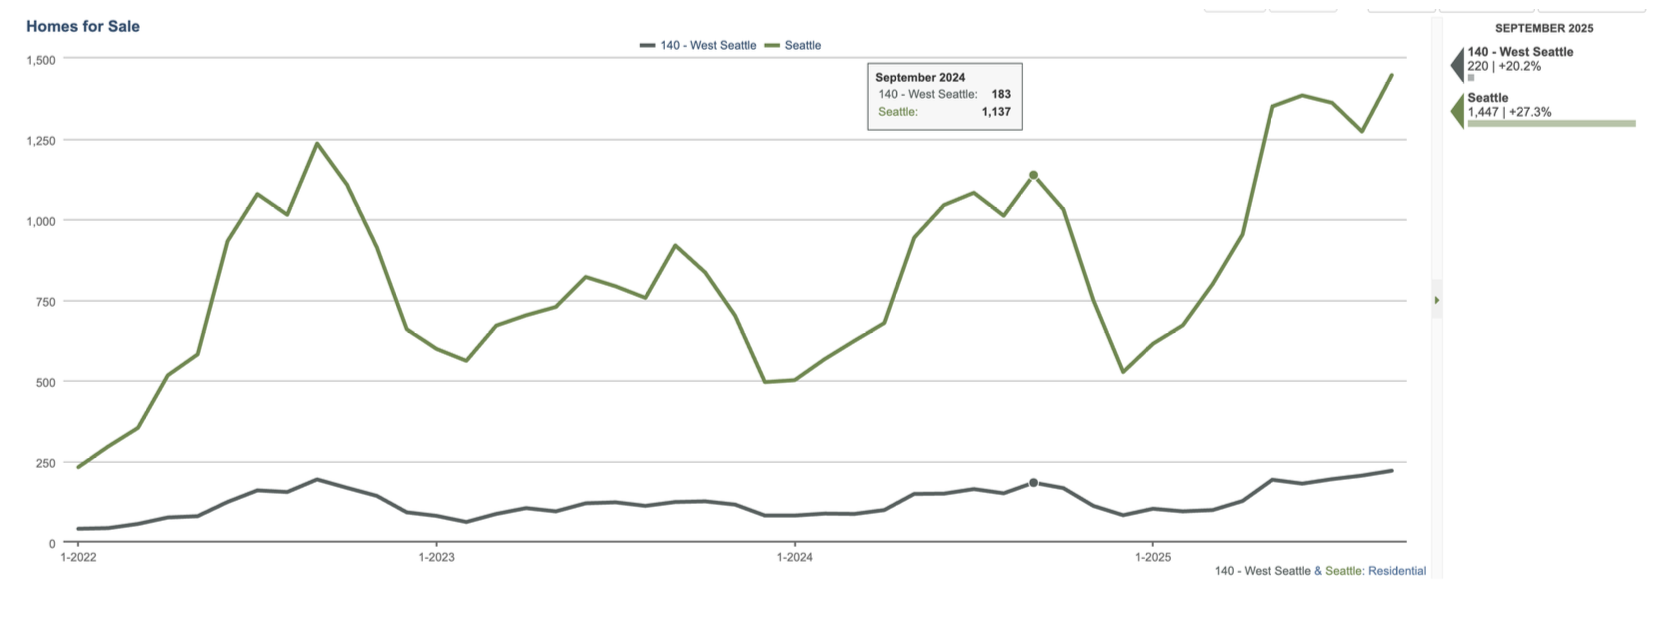
Inventory numbers peaked last month at 220 available homes. This follows seasonal trends of seeing higher inventory numbers later in the year. The Average Days on Market (DOM) for homes ‘for sale’ (Active) is 50 days meaning there is likely a reason they are on market (price, condition or location). The DOM for Sold (closed) homes is 23. Homes that are well priced and in good condition are selling relatively quickly.
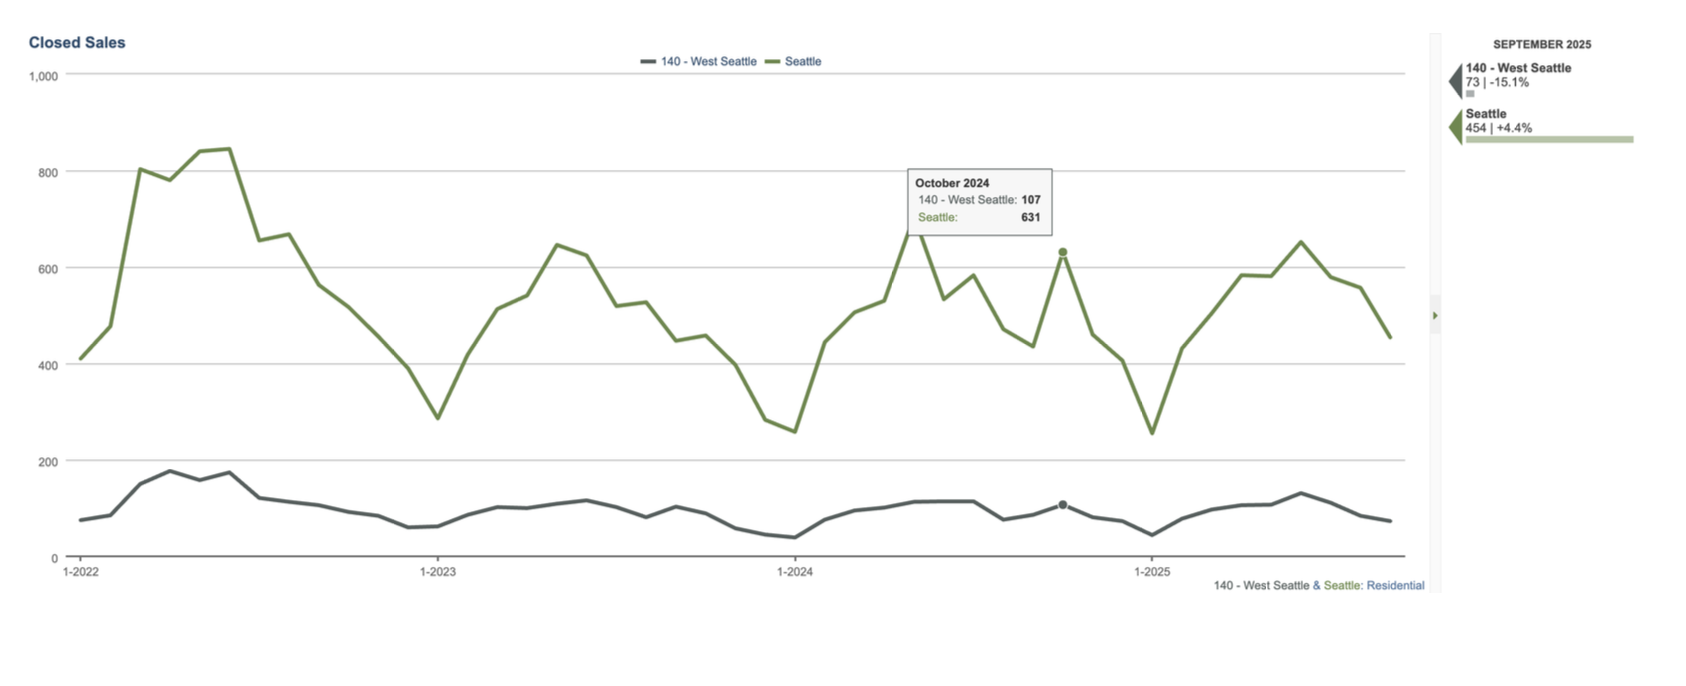
Sold home data is down last month. These closed homes are sometimes more reflective of the previous months activity. It can 2 weeks plus for a transaction to close. We’ll watch in October if this number doesn’t bump up a bit (see last year).
Pending numbers were up a bit at 116 homes going under contract last month. There is typically new inventory, 167 new listings last month, and buyers are back from August vacations and tend to get a bit more active. Historically, market activity does fade as we get into November and December. Good homes, well conditioned and priced, can still sell these months but buyer activity tends not be as brisk as spring markets.

Seattle Metro followed similar seasonal trends. Price slightly down, more inventory, decrease in closed sales but increases in Pending sales. Median pricing has fallen the past several months (from a peak in June of 1.037M) so will watch if that trend continues next month. Overall, the market feels more balanced data wise but we feel certain price points and areas still are pretty competitive. Interest rates did drop a little at the beginning of the month (around 6.25% currently) leading up to the Fed rate drop, but didn’t see it as a major market influencer.

We took a little deeper look into buyer activity to see if there were any new trends developing. The below chart shows agents showing listings (logging into a key box) and this past month followed mostly seasonal trends. Agent/client activity is typically stronger in spring markets and decreases as you get later in the year. It is interesting to look at early 2022 and how many showings each listing had. Rates were sub 5% for the early part of that year. It could also be that buyers look at open houses more than in previous years. There were changes to Buyer Agency at the beginning of the year that has changed how some look for real estate.

This graph looks at how many average showings before a home gets an accepted offer. This is based off of closed sales data but can show there were on average 14 showings per listing before getting an offer. Spring markets bring a bigger buyer pool and fall markets have a little less. But, lower days on market (average 23) and higher SP/LP ratios (101%) show it can still be fairly active.
